Intraday Market Thoughts Archives
Displaying results for week of Jul 26, 2015GBP & CAD Speculative Positioning
Net speculative interest in the British pound and Canadian dollar continues to move in opposite ways, as speculators reduce net short positions in the pound vs USD to 9,788 contracts—the lowest negative balance since November 2014, while loonie shorts contracts against USD swell to 56,067 contracts, the biggest net short balance since March 2014.
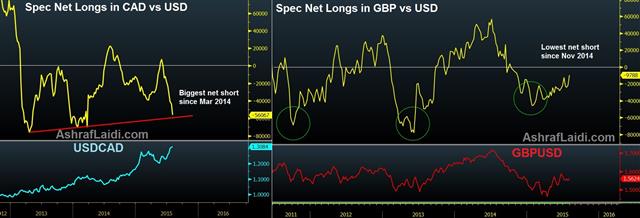
The once stable and non-volatile CAD has been damaged by two rate cuts in less than 6 months, while the pound is boosted by hawkish hints and a recovering economy.
Next week's quarterly inflation report from the Bank of England should lend fresh support to GBP bulls as it confirms the MPC's forecast that inflation will regain its 2.0% target within the next 2 years. In contrast, another disappointing GDP figure from Canada has maintained the selling of loonie bounce, especially as oil sustained a nasty end-of-week dead-cat bounce.
GBPCAD is already at 7-year highs. The more interesting play is to short CAD and long GBP against not-so obvious currency combinations. Our Premium trades currently have two CAD short and one GBP long.
| Act | Exp | Prev | GMT |
|---|---|---|---|
| GDP (m/m) | |||
| -0.2% | 0.0% | -0.1% | Jul 31 12:30 |
The euro-oil relationship
The relationship between oil prices and the euro remains unambiguously positively correlated, especially as the renewed decline in energy reflects a secular bear market in commodities, accompanied by a persistent bull in the US dollar. So does another 5% decline in oil suggests sub-$1.05 in EURUSD?
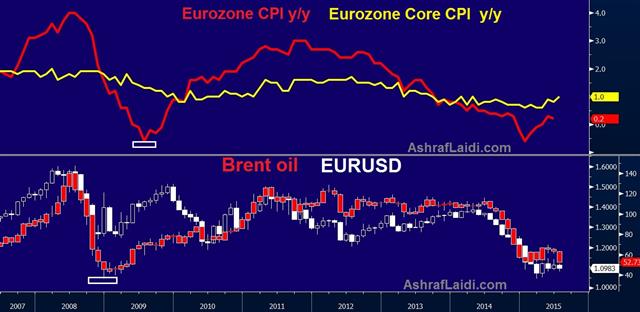
If oil resumes falling, say, after Iranian oil hits the market and China's slowdown take a turn to the worse (or fails to reverse), then how can the euro survive further damage? There are several ways, mainly via the US:
i) Prolonged oil declines will stand in the way of a Fed hike & end up capping USD gains due to renewed CPI weakness.
ii) The extent of above depends on which the US starts to import deflation via strong USD & from a weakening China/Europe.
iii) The extent of the above also depends on the reaction from equities, fretting about deflation & falling capex. The contribution of non-residential investment to Q2 GDP was -0.07%, the first negative contribution since Q3 2012.
Note the chart reveals that both oil and the euro bottomed in early 2009, well before Eurozone inflation, which was largely due to the peak in the USD, coinciding with the bottom in equities. This year, euro bulls require further improvement in inflation expectations, alongside a scaling down in Fed hike expectations.
Is that all? Not really. FX traders will want to remember that the bulk of a currency's change occur ahead of shifting policy cycles and not after.
| Act | Exp | Prev | GMT |
|---|---|---|---|
| Eurozone CPI (JUL) (y/y) [P] | |||
| 0.2% | 0.2% | 0.2% | Jul 31 9:00 |
| Eurozone CPI - Core (JUL) (y/y) [P] | |||
| 0.9% | 0.8% | 0.8% | Jul 31 9:00 |
| GDP (Annualized) (2Q) [P] | |||
| 2.3% | 2.5% | 0.6% | Jul 30 12:30 |
| GDP Price Index (2Q) [P] | |||
| 2.1% | 1.5% | 0.1% | Jul 30 12:30 |
Jackson Hole all about Inflation
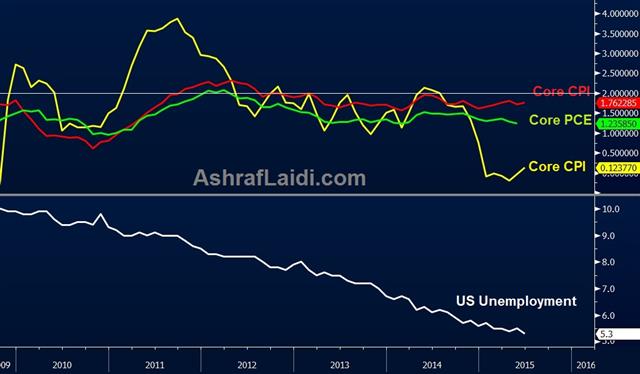
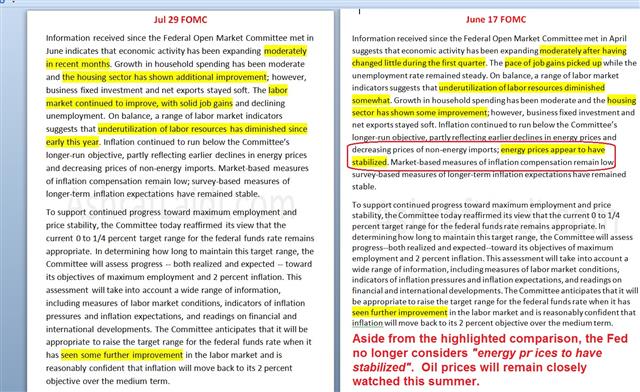
Another FOMC statement and another swing at the law of probability. Some banks are considering the probability of a September Fed hike to be as high as 70%. Others prefer to hedge themselves with more appropriate qualitative means of referring to September as a “high probability outcome as long as….”, citing the two upcoming jobs report and their average hourly earnings components. But even if the next two jobs reports are accompanied by robust hourly earnings, the inflation objective remains in doubt. We've long mentioned in previous pieces how the 20% decline in oil since early May will further retard any recovery in price growth, which has prompted the Fed to drop its phrase in the FOMC statement that “energy prices have stabilized” discussed here.
No Fed hike if oil stays below $50
We assert that it will be impossible for the Fed to raise rates this year if US crude oil remains below $48.00—even if the next non-farm payrolls come in between 200K and 300K. The October-March decline has already triggered a chain reaction of broadening cuts in capital and labour expenditure, which effectively cast a spell on the suppliers of these energy and mining companies. And barely when oil began its spring time recovery, the declines emerged anew.Fed hawks will ignore inflation and focus on unemployment, payrolls and wages. They will add that the non-accelerating inflation rate of unemployment aka equilibrium level of unemployment is at 5.3%-5.5%, matching the current unemployment rate of 5.3%.
Fed doves will point to the fact that inflation has remained below its 2.0% target for the last three years, while the true NAIRU stands a lower 5.0%.
Market-based vs survey-based inflation
Dissecting market and survey-based measures of inflation will also become a popular sport in the months to come. The once popular but now questionable 5-year forward break-even inflation reference (5-year treasury yield minus US inflation-linked bond forward 5 years), appears to have bottomed at 2.08% last week, before gradually recovering to 2.2% today.More importantly for the Fed, will be the crucial core PCE price index, due for release Monday, expected unchanged at 1.2% y/y. The August 19 release of US CPI as well as survey-based inflation components from the ISM, University of Michigan sentiment and regional PMIs will take centre stage.
Jackson Hole will be about inflation, not jobs
Holding oil and the US dollar constant (if we can realistically do that), the path for a Fed hike this year does make sense. But bringing back reality into the situation, including a disinflationary USD and recessionary oil/mining sector, the question should re-emerge at the Fed's August 27-29 annual Economic Policy Symposium at Jackson Hole, where unsurprisingly the topic of this year's conference will be “Inflation Dynamics and Monetary Policy”, following last year's topic, which centered around labour markets. Fed chair Yellen will not be present at this year's conference, but the heated debated about the topic will not be absent, especially as it will take place 3 weeks days before the Sept FOMC and 7 days after the latest Greece deadline.| Act | Exp | Prev | GMT |
|---|---|---|---|
| Chicago PMI (JUL) | |||
| 50.5 | 49.4 | Jul 31 13:45 | |
The other omission from the Fed statement
The FOMC statement was not as hawkish as many anticipated. Despite that, the US dollar remained resilient afterwards, we look at what that means. Up next we hear from the RBA leader and get Japanese industrial production data. Our Premium long in EURUSD from Jul 21 at 1.0890 hit its final 1.1120 target on Sunday. Today, we opened a new USD long, supported by 2 charts and 4 reasons. The snapshot below highlights the omission of the Fed's phrase from the June meeting that it regarded energy prices to have stabilized. Since the 20% decline in energy prices took place, the Fed has not only taken notice, but any further decline in prices may creep into the Fed's inflation viewpoint.
The Fed has a dual mandate of full employment and low, stable inflation. Yellen is increasingly comfortable on the first part. The statement also noted that “some further” progress on jobs was still needed before raising rates when previously it said only “further”. The addition of “some” is a signal that the economy is closer to meeting the first part of its mandate.
That means that even with two solid but not spectacular non-farm payrolls reports before the next FOMC in September, that jobs portion of the mandate could be satisfactory.
The problem is on the inflation side. Over the past two weeks, breakeven rates have been tumbling, signaling less confidence from the market that the Fed will bring inflation back to 2%.
That's come in tandem with worries about China and the drop in oil prices. Some traders may continue to focus on jobs but many Fed officials over the past month have said signaled some discomfort on inflation and that's the data we will watch most closely. At the same time, if upcoming jobs reports are very strong, that could still give the Fed enough confidence that the economy is accelerating and that wages will soon rise to hike rates.
Overall, the Fed has remained true to its words in saying it will be data dependent. We now have almost two months before any Fed decision. The market is showing about a 40% chance of a hike and the ebb and flow of data will be critical.
What's also critical is how markets have reacted. This was a slightly dovish result but after a dip, the US dollar gained. That's a sign of strong underlying demand. Dollar bulls have been nervous over the past week but so long as data remains solid, they will grow increasingly assertive.
On the agenda next is RBA Gov Stevens who is speaking on a panel discussion at 0100 GMT. He's never shy about his feelings on the economy.
At 2350 GMT, Japan releases industrial production in the top release of the day. It's expected to rebound a modest 0.3% after a 2.1% fall previously. Japan needs to start showing signs of turning a corner or the BOJ will begin to feel pressure to act.
| Act | Exp | Prev | GMT |
|---|---|---|---|
| Industrial Production (JUN) (m/m) [P] | |||
| 0.3% | -2.1% | Jul 29 23:50 | |
| Industrial Production (JUN) (y/y) [P] | |||
| -3.9% | Jul 29 23:50 | ||
نحو الإحتياطي الفدرالي و بيانات الخميس و الجمعة
Commodity FX Bounces, Japan Retail Sales Next
A rebound in risk trades and raw materials underpinned commodity currencies Tuesday, we evaluate whether or not it will last. The New Zealand dollar was the top performer and continued to rise early in Asia-Pacific trading on Wheeler comments while the euro lagged. Japanese retail sales are up next.
It was Turnaround Tuesday in most markets. Beaten down assets like stocks and commodities rebounded in a squeeze higher. After weeks of non-stop selling, oil bounced nearly $2 from the mid-April lows and that sent USD/CAD down to 1.2915 from 1.3015 in US trading.
These types of rapid squeezes are typical corrections in trending markets. The catalysts at the moment were position squaring ahead of the FOMC and month end. The generally last 1-3 days and are often opportunities to re-establish positions at better levels.
The kiwi rallied in early Asian trading, hitting 0.6739 from as low as 0.6595 the day before. RBNZ Gov Wheeler reiterated comments from last week's rate cut statement. That indicated he wasn't overly concerned about the post-statement bounce in the kiwi. He didn't introduce any harsher jawboning and that sent NZD/USD a half-cent higher.
Expectations for the Fed are modest with most market watchers expecting no strong hints and a continued ode to data dependency. One data point that may have given the Fed pause Tuesday was consumer confidence at 90.9 compared to 100.0 expected. It was one of the biggest misses on record and took the index to one-year lows.
Before the Fed the Bank of Japan is in focus with retail sales for June due at 2350 GMT. The consensus call is for a 0.9% m/m decline. It comes on the heels of a 1.7% surge the month before but it's still unwelcome news for the BOJ as they weigh whether to stimulate further.
| Act | Exp | Prev | GMT |
|---|---|---|---|
| Retail Trade s.a (JUN) (m/m) | |||
| 1.7% | Jul 28 23:50 | ||
| Retail Trade (JUN) (y/y) | |||
| 0.5% | 3.0% | Jul 28 23:50 | |
| CB Consumer Confidence (JUL) | |||
| 90.9 | 100.0 | 99.8 | Jul 28 14:00 |
Now & October 2014
Will the S&P500 & Shanghai Composite both do what's expected of them? Bounce off their 200-DMA? The Shanghai Composite index stabilized overnight at its 200-day MA for the 3rd time in over 20 days and S&P500 closed right above its 200-DMA on Monday. The usually inversely related EURUSD broke its June trendline resistance, regaining its 100-DMA but failed to climb above its 55-DMA. Buy-the-dip complacency in equities may suggest the S&P500 will bounce off the key 200-DMA as it has done on July 7, 8, 9 and 10.
Moving into the weekly horizon, however, the divergence between the Dow Jones Industrials Average and the S&P500 becomes interesting, with the former breaking below its 55-WMA for the 1st time since the infamous week of mid October 2014, when the Fed officially ended QE3. And so in order for S&P500 to reach its 55-WMA, it would have to lose another 20-pts or 0.98% from Monday's close.
Few Differences between now & October
We have seen all of this before during the escalating volatility of October 2014, all of which emerged from a rising US dollar as the Fed announced the end of QE3. Bond yields sustained a violent plunge alongside falling equities, which dropped nearly 9% from their prior peak.Yet, the vital dinstinctions between today and October are: i) the stock market carnage in China; i) the protracted collapse in commodities; iii) the return of deflationary concerns; as well as iv) their implication for capex.
All we worried about back October was a slowing Eurozone and a winter-bound US economy. The Bank of Japan helped save the day by stepping up QE and the ECB did the same by signalling QE later in November.
With FOMC forecasts currently signalling TWO rate hikes in 2015, will this save the day?
5 Things About the Chinese Stock Rout
US core durable goods orders were solid on Monday but failed to boost the US dollar because the shipments components were weak and that's likely to hurt GDP later in the week. The euro was the top performer as it rose above 1.11 while the Australian dollar lagged on China worries. We take a closer look at the rout in Chinese stocks and try to put it into perspective. Our EURAUD Premium long @ 1.4690 from June 17 is currently netting +520 pips. EURUSD and USDCAD are also in progress.
1) “The worst selloff in 8 years”
The 8.5% fall on Monday is technically the worst fall since the crisis but it only marginally exceeds some other recent declines and is well short of some of the 10% intraday moves in recent months. It's a big fall but the game hasn't changed.
2) The signal from base metals is more worrisome
The Bloomberg base metals index is down 6% since May and at the lowest since 2009. This, much moreso than Chinese stocks sliding, is a reason to worry about the Australian dollar. Iron ore prices remain above the July lows but they're in danger.
3) The Shanghai Composite is up 79% in the past year
Lost in all the talk of a 28% fall from the June high is a reminder that since July 27, 2014, the index is up 79%. That kind of performance and the 15% ytd gain would be the envy of the world if not for the associated volatility.
4) Chinese policymakers reiterated a desire to help
The most noteworthy news in US trading was a denial from China Securities Finance that it was leaving the market. Officials reiterated that they will continue to act as a market stabilizer and will increase buying. That could help calm markets today.
5) Distrust Everywhere
We don't think it's now but one day there will be a true rout in China and this episode offers important lessons. One is that Chinese opacity constantly leaves the market in doubt and on edge. There is a report that China has spent as much as 550 billion pounds in stock buying. A survey of emerging market money managers shows most believing Chinese growth is in the 5-6% range, not 7%. There is a deep distrust of China that can turn a blip into a panic at any time.
| Act | Exp | Prev | GMT |
|---|---|---|---|
| Durable Goods Orders (JUN) | |||
| 3.4% | 3.2% | -2.1% | Jul 27 12:30 |
| Durables Ex Transportation (JUN) | |||
| 0.8% | 0.5% | -0.1% | Jul 27 12:30 |
Gold net Longs Break Support
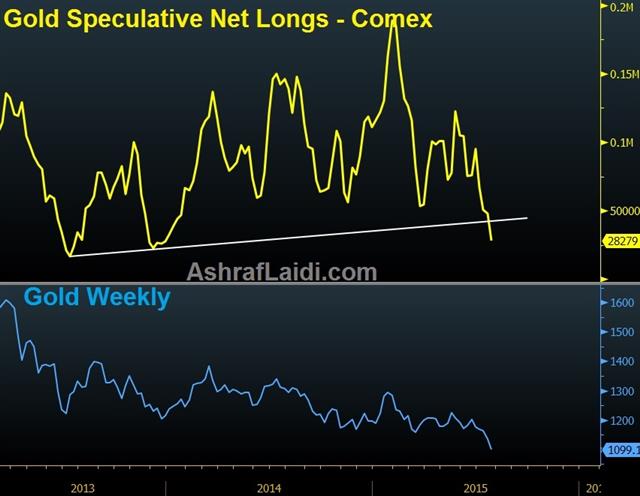
This Sunday didn't start with gold speculators selling over 55 tonne in less than 2 minutes as was the case 7 days ago. But the effect of last week's gold collapse has been revealed in the latest report of speculators' commitments from the Comex, showing net longs plunging 41% to 28,279 contracts, the biggest percentage decline since November 2013.
Will this week's combination of a hawkish FOMC, an upward revision in US Q1 GDP and a better than expected US Q2 GDP release, emerge as the worst combo outcome for gold? A $1,030 print is next on the cards, followed by $920.
The difference between a hawkish Fed FOMC statement and an actual rate hike could be a about $200 bn in cancelled energy projects and over $25 bn in potentially distressed energy-related bonds.
