Intraday Market Thoughts Archives
Displaying results for week of Oct 07, 2018التمسك بثقة النماذج
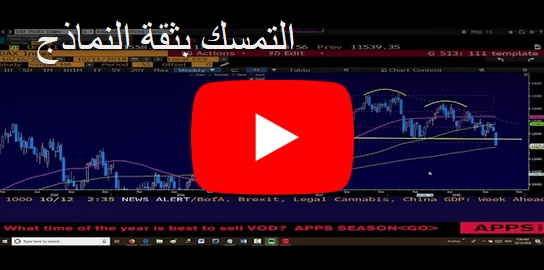
ماذا حدث لنموذج الرأس و الكتفين المنعكس التي تكون على مؤشر الدولار؟ أين أصبحت الاهداف الان بعدة هزة الأسواق يوم الاربعاء؟ الفيديو الكامل
Where to Ride out the Volatility
We look at the causes of the latest round of fear and volatility and where to ride out the storm. Stock markets were hammered again Thursday but it was the New Zealand dollar that led the way in a sign of shifting correlations. China trade balance is due up next. Thursday's Premium trade is firmly in the money after gold was bought at 1199. The thesis was put forth in this week's English and Arabic videos. Why did Ashraf pick Thursday morning to buy gold? Why not in other occasions when gold touched 1200?
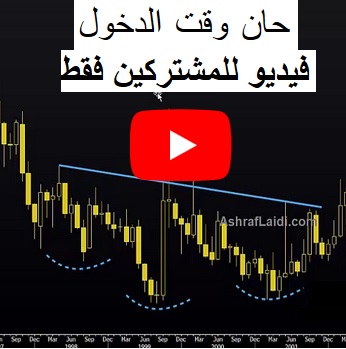
حان وقت الدخول (فيديو للمشتركين فقط)
There was no single trigger for the rout in markets but a handful of factors came together, leading to a tipping point.
1) Rates
Fed hikes are coming whether Trump likes it or not. The Fed will take pains to appear to be independent and that could harden their resolve to hike. In any case, the market is signalling a new regime of higher rates and potentially higher inflation. What would become of the 4.2% GDP growth when we take out 2.0% inflation, followed by the expiry of Trump's tax stimulus? 3.20% yields become an obstacle, especially when the IMF downgraded growth for the US and Europe.2) The trade war
There was one good sign Thursday as the WSJ reported that Trump will meet with Xi at the G20 but the news has been overwhelmingly negative. It's no coincidence that equity selling started after Pence's anti-China speech. The lines are being drawn for a long battle.3) Earnings
Big financials kick off earnings season Friday. Citigroup in particular might have insight into how consumers are coping with higher rates. More broadly, the focus will be on guidance and commentary because the near term numbers will be strong. Companies warning about global growth may turn this from an equity event into a rout in FX.4) China
Perhaps the most - concerning chart right now is the Shanghai Composite. Yesterday's 5.2% decline broke major support in a drop to the lowest since 2016.Where to ride it out
Gold showed genuine signs of life Thursday in a $30 to close above the September highs. With bonds, equities and almost everything else falling, there's an increasing demand for safety, even if it pays nothing. More demand makes sense with looming trouble coming from the US midterms, the continued China battle and rising interest rates.Looking to China, the trade balance report is due later but there were also rumours that the Treasury would name China a currency manipulator on Monday when the semi-annual FX report is expected to be released (there is no firm release date). A Politico report said it will be the status quo but that news did little to calm markets. Ashraf reminded us of the unusual event of the dollar failing to rise during the equities' selloff. That could be part and parcel of pre-empting a reflexive rise in the Chinese yuan. And we know how that correlates with gold.
| Act | Exp | Prev | GMT |
|---|---|---|---|
| FOMC's Bostic Speaks | |||
| Oct 12 16:30 | |||
ما بعد هزة الاسواق؟
كان حجم الانخفاض العالمي في سوق الأسهم يوم الأربعاء ملفتًا للنظر. لكن هناك بعض العوامل المهمة التي لم تغطها وسائل الإعلام التي تستحق التحليل. فيما يلي أسباب الهبوط الحاد وأهم شيئ ما اتوقعه للاسواق و الدولار التحليل الكامل
Je vous verrai dans 24 hrs a Paris
XTB-France avec la participation d'experts des marchés financiers et professionnels de la bourse, vous invite à l'événement de l'année 2018 au sein des Salons Hoche à Paris Jeudi le 11 octobre à partir de 18h30. Alexandre Leclair, Karen Peloille, Ashraf Laidi, Luc Vaudan & Jean-Louis Cussac. Inscrivez-vous maintenant.
Reconciling the Two Formations
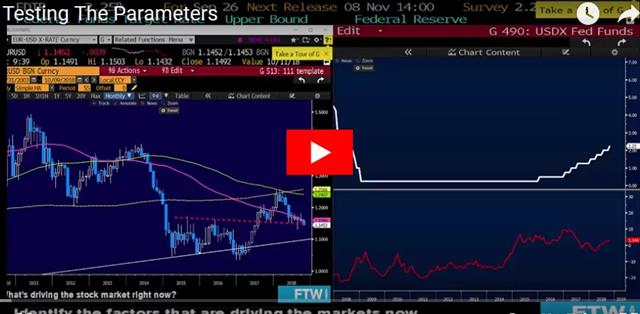
Is the formation on the WEEKLY EURUSD chart from July 2017 to today showing a head-&-shoulder formation? Is the formation valid? What about the inverted head-&-shoulder formation on the DAILY EURUSD? Is that valid? How do the two formations reconcile or support one another? I have already tackled this issue in the Premium video titled “Invalid Thesis” from Sep 17, only for the analysis to be challenged these past few days. That is why I put forward a new video yesterday titled “Testing the Parameters”, highlighting the key levels required to judge whether USD bulls will find their day in the sun again by dissecting USDX, EURUSD, USDCAD, USDCHF and USDJPY. The thesis in the video is supported by slides from my upcoming presentation in Paris tomorrow. It touches upon some common mistakes in charting, while recalling those crucial days in mid-August and how we can learn from them. These EURUSD and USDX developments remain central to all macro traders. The full Premium video is here.
The Big Question for Dollar Bulls
The big question for 2018 is how much the Federal Reserve will hike interest rates and how markets will react. The yen is the top performer, while the euro lags. The Premium DAX short hit the final target for 300-pt gain (400 if allowed thru the lows), while the EURGBP long was stopped out at 100-pip loss. The Premium Video "Testing the Parameters", highlighting the state of FX and indices will be posted & sent to subscribers.
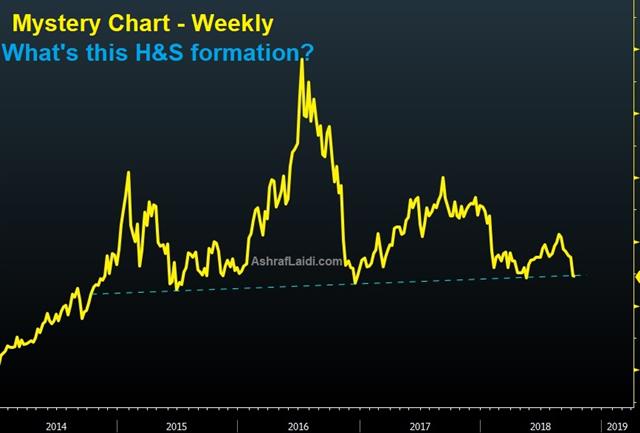
The bond market and the yen have been sending opposing signals for the past few days as yields rise but USD/JPY stays low. That's partly due to risk aversion but it raises many questions about the path of interest rates.
The Fed is currently ebullient about the state of the economy but that's always how it looks just before trouble starts. 2018 is likely to be the best year of growth in the US in years and economists also believe growth will slow in 2019 and beyond.
Consider today's announcement from Goldman Sachs that it is scaling down targets for its consumer lending platform Marcus, reflecting concerns about the consumer debt market.
What's worrisome is how interest-rate-sensitive areas of the US economy have already stumbled. Auto sales have been weak this year and a big reason why is tighter financing conditions. Signs are also increasing that US housing is sluggish. The home builder ETF fell Monday for the 13th consecutive session and a US 30-year fixed mortgage rate has risen to nearly 5%.
A big mystery of the post-crisis economy is how well consumers can handle higher rates. The answer is likely to be: not as well as before the crisis. That could ensure the Fed pauses in 2019 before many believe. Here's what Ashraf said 3 years ago about USD performance during Fed tightening. Does the study still hold?
Trade Deficit Tribulations
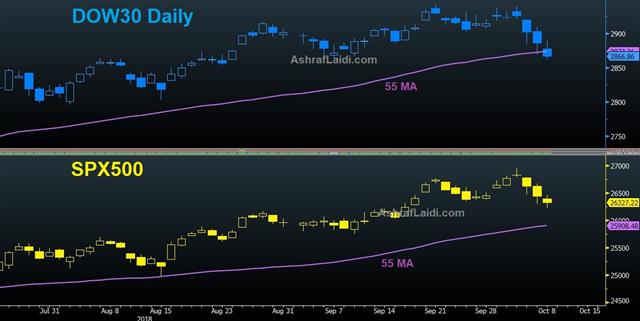
US indices join their European counterparts in extending selling below Friday's levels on a combination of Italy deficit concerns and the overall spike in global bond yields. Non-farm payrolls on Friday stole the headlines but at the same time the US August trade balance report was issued and that part of the economy is the one to watch. The yen is the strongest performer of the day, dragging USD to 113. Ashraf tells me to keep an eye on the fact that SPX is testing its 55-DMA, while the DOW30 is 1.3% above its own 55-DMA, possibly implying that 25950 will be seen on the DOW30.
The US trade deficit rose to $53.2 billion in August from $50.0B in July. The bilateral deficit with China was at $34.4 billion. In the months ahead, this number could expand further and draw the ire of the White House. One reason for a jump in growth in Q2 was a surge in soybean exports to beat the tariffs. There may be similar moves in Q3 as electronics companies reported stockpiling.
Signs are growing that it will reverse late in the year. US soybeans are a major export and the selling season typically runs from Aug-February. In August, exports to China fell to nearly nothing from a typical amount of $550 million. By Oct/Nov the monthly rate usually rises to $2.5 billion. As that dries up it will further dent the deficit. Of course, farmers could export elsewhere, but they could also grow inventories.
The risk is that's just one area where US exports suffer. In addition, the US is also operating at full capacity. NAFTA stockpiling could also reverse and lead to other distortions. In short, economists have poor accessibility and insight into how trade flows have been disrupted and will affect the economy. Surprises are coming, especially in real time data and the risk is that the result is a weaker economy and a more-aggressive White House. This could also drive the USD rhetoric from the White House ahead of the mid-term elections...as it did 8 months ago.
Looking towards the new week of trading, Japan, Canada and the US start the week with holidays so trading may be light.
CFTC Commitments of Traders
Speculative net futures trader positions as of the close on Tuesday. Net short denoted by - long by +.EUR -7K vs +4K prior GBP -59K vs -67K prior JPY -114K vs -85K prior CHF -13K vs -16K prior CAD -19K vs -20K prior AUD -72K vs -72K prior NZD -31K vs -32K prior
The aggressive yen selling is somewhat jarring. An already-crowded trade moved into extreme territory, undoubtedly as a result of bond yields breaking above resistance. The worry is that this leaves little speculative fuel left for the big move that many are betting on.
AUD shorts, meanwhile, continue to be rewarded with fresh lows dating back to 2016 and 0.7000 under threat.
المؤشرات في أيدي السندات
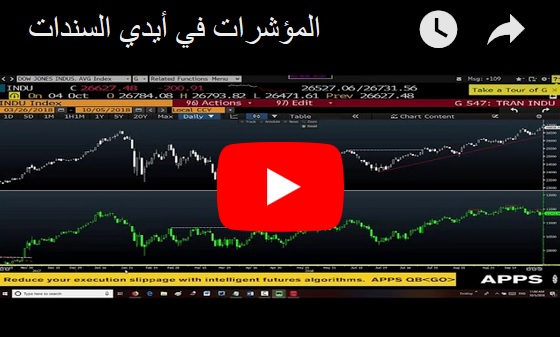
كيف سيؤثر ارتفاع عائد العشر سنوات على السندات الأمريكية على مؤشرات الأسهم؟ تعلم أهم قواعد التحليل الأساسي و كيف تؤثر العلاقة بين الأدوات المالية المختلفة في توجهات أسواق المال الفيديو الكامل


