Intraday Market Thoughts Archives

Displaying results for week of Jan 09, 2022

USD Bears May Wait a Bit More

Jan 14, 2022 17:37 | by Ashraf Laidi

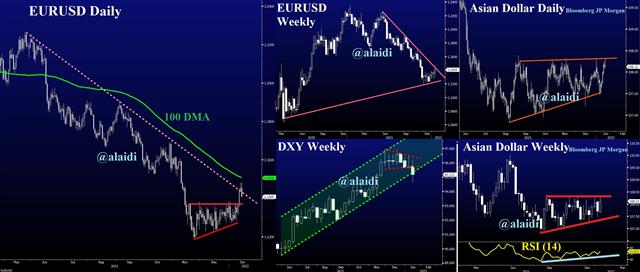
As much as we'd like to embark on the sell-USD bandwagon as early as possible, we think it is yet best to wait. Studies showing USD weakness starting 3-4 months before Fed rate hikes sound astute and clever, but they're based on average movements and serve as poor guides for swing traders. They will not help you anticipate corrections or pullbacks in current USD weakness. But as the charts below show, there are trends, countertrends and much signaling inside the noise. 

Click To Enlarge
USD Bears May Wait a Bit More - Adxy Dxy Jan 14 2022 (Chart 1)

The EURUSD daily chart broke out of its wedge on Wednesday's CPI release, allowing us to signal the WhatsApp Broadcast Group to go long at 1.1390s and target 1.1455/60. Will the top of the wedge become support at 1.1380s?  On the weekly timeframe, EURUSD remains above a less convincing trendline support from the March 2020 low, calling up 1.1200 support.

The not-so-soon warning on USD decline is backed by the weekly DXY chart near 94.90s. 

Finally, the daily and weekly charts of the Asian Dollar Index (provided by Bloomberg-JPMorgan) indicate a robust ascent with an imminent break to the upside. The importance of the ADXY lies in its close correlation with gold, especially during those confusing phases when DXY and XAUUSD moved in tandem. For an explainer on ADXY and XAUUSD, watch from 25:10 mins of this video. 


Gold Silver الذهب مقابل الفضة

Jan 12, 2022 15:34 | by Ashraf Laidi

Watch here شاهد هنا

Gold Silver الذهب مقابل الفضة - Gold Silver Video Snapshot (Chart 1)

داخل رياضيات الذهب

Jan 11, 2022 13:54 | by Ashraf Laidi

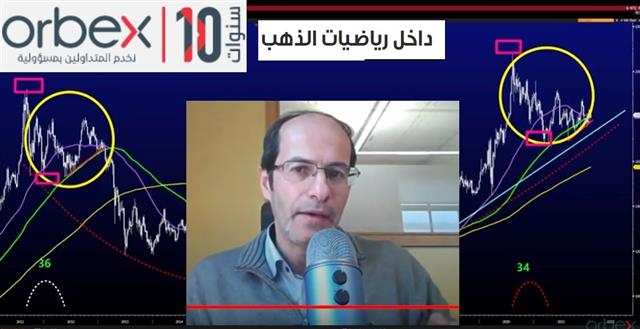
هل يمكن الاعتماد على التحليل_الزمني باستعمال الرياضيات؟ وما هي العوامل الفنية والأساسية التي ستنقذ الذهب من رفع الفائدة؟ تعرّفوا على التفاصيل في هذا الفيديو الحصري مع أشرف العايدي
 

Shorts Beware

Jan 10, 2022 17:31 | by Ashraf Laidi

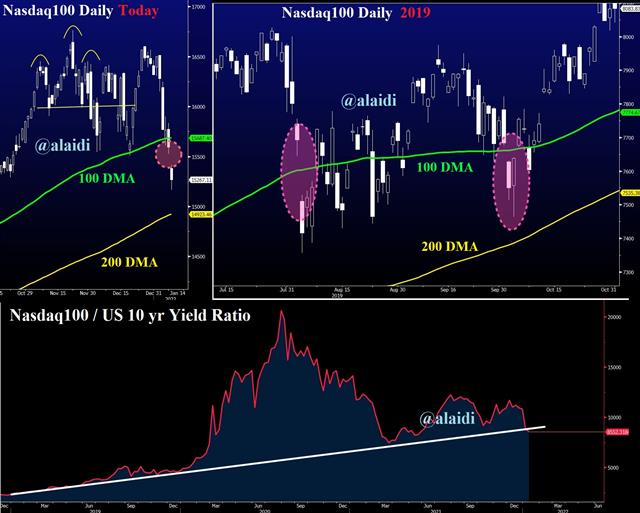
The challenge with sharp selloffs in indices is drawing retail traders just as the decline begins to stabilize. Could the Nasdaq selloff be reaching the end? The charts below suggest caution for the shorts. The top 2 charts show a rare occurrence of Nasdaq gapping down, while breaking below its 100-DMA of 15680. The last time this happened was in 2019, coinciding with a bottom and subsequent recovery into new records. The bottom chart shows the Nasdaq/10-yr yields ratio is testing a 3-year trend line support. Will it break?

Click To Enlarge
Shorts Beware - Nasdaq Yields Jan 10 2022 (Chart 1)

The surge in US bond yields is helped by the broadening cacophony from FOMC members expressing the need to catch up on their price stability mandate. Most challenging for bonds (positive for yields) is the prospect of simultaneously raising interest rates and quantitative easing (Fed selling of bonds after completing the taper process). Beware that a close above 15700 would qualify as a breach below the 100-DMA, but still respect a minor horizontal support—regardless of the candle wick. 

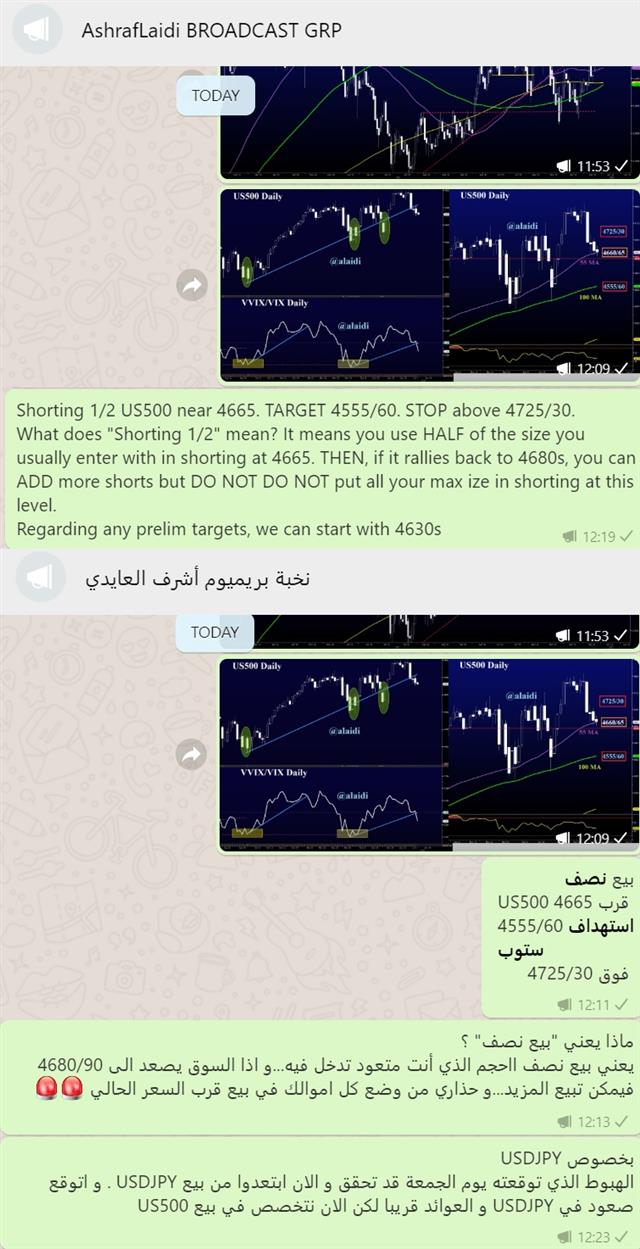
The snapshots below show our messages to the WhatsApp Broadcast Group, where we shorted SPX near 4665, targeting preliminary 4630s and 4560s. Whether the index extends to its 100-DMA remains to be seen. Don't forget also we're close to the 10% correction territory, where algos buyers start to wake up.  It's only Monday and the chorus of FOMC speeches scheduled for the week is suggests the lows are not yet in, but not necessarily far way. Stay tuned. 
Click To Enlarge
Shorts Beware - Whatsapp Spx Post Jan 10 2022 (Chart 2)