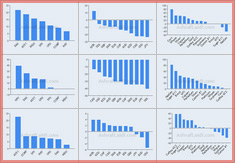
21-yr Intermarket Charts - 7 indices 11 currencies 14 commodities
Annual performance of indices, currencies & commodities since 1993
Interactive charting by instrument, chronological and alphabetical order. This enables organizing each individual commodity, currency or equity index' performance by magnitude or chronological order.


This content is accessible to Premium Subscribers. Please sign on.

- Which currency had the longest period of outperformance?
- What is the “January Effect” in currencies and what it means for 2014?
- What did USD, JPY and GBP have in common in their relation with gold?
- How did the two oil-based currencies (CAD & NOK) perform against each other over the last 21 years?
- Gold, platinum and Brent oil were the only commodities to have rallied against the USD in 14 of the last 21 years. Which agricultural commodity rallied for the most of number of years, and which had the most losing years?
- Which equity index posted the smallest decline during the crash year of 2008?
- How did the Bush Administration's policy on corn affect grains and the Aussie?
- Nasdaq accumulated the highest percentage in 2008-2013. Which index advanced by the most prior to the housing crash (1993-2007)?


