Articles
April Fears Ahead of Fed, Spain & China
by
Apr 18, 2012 19:04
Forced Liquidation or Improved Sentiment?
Recent intermittent bounces in EURUSD in the face of surging Eurozone spreads are said to be reflecting possible liquidation by European banks unloading US assets to relieve an ensuing shortage of US dollars. Other explanations were attributed to the IMF buying Irish and Portuguese bailout tranches during the late European trading hours, taking advantage of cheaper levels (lowest since Feb 15). But as long as traders find no confidence in battling the coordinated efforts of asset-buying central banks and the Fed produces no new dissenters to the ultra low rates til 2014 mantra, risk currencies may be assured to find support.
Spanish government bonds are now the latest victim of bond traders typical one-country assault amid speculation that Spain will be the 4th recipient of a Eurozone bailout. At a time of deepening recession, Spanish authorities have selected education and health sectors for 10 billion in budget cuts. Cuts in these sectors have yet to prove successful or sustainable the he Eurozone. Little surprise that the biggest yield gainers are of nations, which have not yet been bailed outSpain and Italy. Considering that Greece, Ireland and Portugal were each bailed out when their 10-year yields crossed the 7% level, we ought to watch Spanish yields, currently at 5.9%.
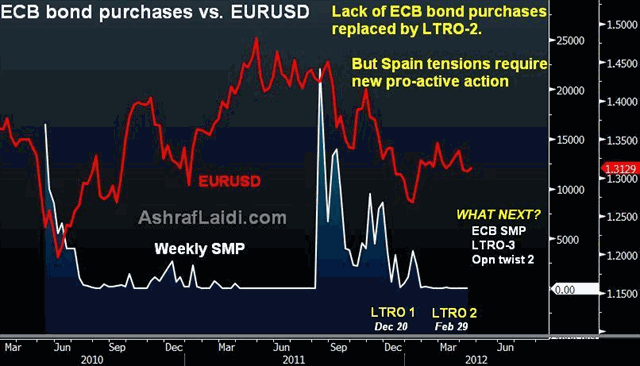
The chart below shows how zero purchases from the ECBs Securities Market Programme (SMP) was replaced by the LTRO-1/2 program and Greek Private Sector Initiative deal (PSI), all of which were effective in shorting up risk appetite and the euro at the expense of sovereign yields. Unless the ECB acts with the next dosage of stimulus (LTRO, SMP or swap operations with the Fed, EURUSD is most likely to finally break the $1.2950 floor.
Double Click to Enlarge

No Game-Changer So far
As long as the aforementioned dynamics continue to offset each other, EURUSD could remain in its $1.30-$1.32 range, inside which algo traders shall squeeze each and every drip of this hefty range.
Just as we were told that tipping points are usually not governed by a singular event, no single event is likely to produce the game-changing pattern to the current consolidation in currencies. Instead, the combination of mounting challenges to Spains ambitious deficit-reduction efforts, returning risk-aversion ahead of a potentially-hawkish surprise at the April 25 FOMC and softening signals from Beijing could build sufficient buying momentum in the US dollar at the expense of the euro, and finally break the $1.2950 support.
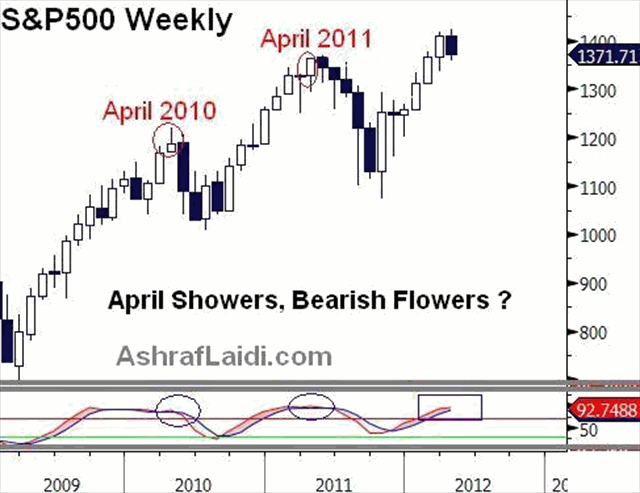
Back in March we warned about the recurring declines in April and beyond. April has proven a difficult over the last 2 years. US markets topped out in late April 2011 as well as in April 2010.
Meanwhile, the VIX is on its way of posting the first positive month since September. The last time we had 6 consecutive monthly declines in the VIX was in 2003, which was also the end of the Feds easing campaign following the 2000 tech bubble.
S&P500 is off its April 10 lows when it fell 4.5% from its 4 year highs attained earlier in the month. But we should watch out for the 7% peak-trough declines before making any decisions on whether the decline is the start of a deeper correction rather than merely a pullback re-energizing the next leg up. 7% has proven the maximum decline the S&P500 index has posted without making any deeper correction. The last time the S&P500 fell by 7% was in Oct-Nov 2011. And the prior occasion before that was in Feb-March 2011. Whether the next decline will be significant (more than 10%) or simply profit-taking, setting up for the next rally remains to be seen.
Double Click to Enlarge

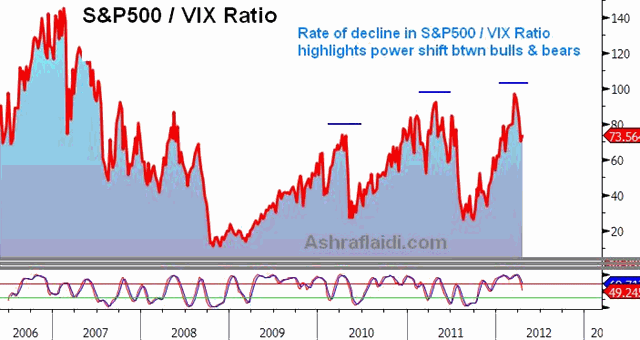
While market observers usually focus on the S&P500 and the VIX individually, we assess the equity index relative to its own volatility index, which best captures the balance between the bulls and the bears. The technical developments in the SP500/VIX ratio illustrate a familiar and typically bearish pattern (head & shoulder formation). As such, the right shoulder signifies a failed attempt of the ratio to recapture the head (top of spring 2011). The significance is also highlighted by the fact that the failed recovery nearly matches the left shoulder, the high of early 2010.
Double Click to Enlarge
Click To Enlarge

We saw last week how each of the five major peaks in BRICs indices prompted (or coincided) pullbacks in G10 equities. As US equities enter a much-scrutinized earnings season, the catalysts for the long-awaited pullback are several (Feds possible signaling of escalating price pressures at April FOMC, further gains in yields, need of 2nd Portuguese bailout and policy uncertainty from Beijing).
Combining the historicity of April tops, the potential for more hawkishness at the April FOMC meeting and the cyclical progress of US jobless claims, Traders ought to keep an eye on this month.
Get your free 1-week trial to our Premium Intermarket Insights on FX, commodities & equity indices
Follow us on Twitter @Alaidi


