Charting S&P 500 Breadth & Multiples
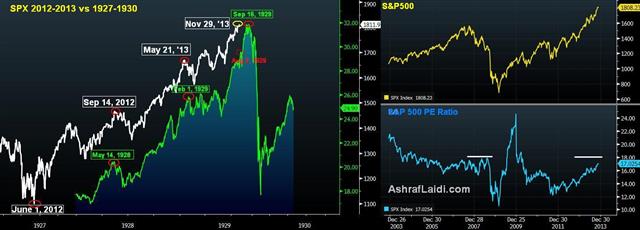
When Fed Chairman-nominee Janet Yellen said in her testimony earlier this month that stocks were not in a bubble, citing PE ratios, many found it a fresh motive to buy. 8 months after the S&P500 broke a new record to take on its 2007 highs, the index is up an additional 16% from those highs. Year-to date, the S&P500 is up 27%, which if maintained, would be the strongest year since 1997, when it logged 31%.
PE Nearing 2007 Levels
Back to the price to earnings ratio. Currently at 17 times earnings, the multiple is dangerously close to the 17.60 level reached in October 2007, just prior to the 2007-09 crash. But 17.0 is no comparison to the 30.0 multiples prevailing at the height of the dot com bubble. Low PEs relative to soaring prices imply soaring earnings as a result of deep cost-cutting from companies. Up to what point can earnings defy slowing sales remains a key question. A more reassuring metric for the bulls is the price to book ratio (focusing on balance sheet book value). Today's price to book ratio for the S&P500 is at 2.6, compared to the 2.9-3.0 prevailing in June-September 2007 and the 4.9-5.0 prevailing in Q1 2000.

Breadth Remains High, but…
A key distinction from the late 1990s bubble is the breadth of the rally. 446 socks in the S&P500 are up, which is the most since 1980. Half of those stocks are up more than 30%. Today, 82% of S&P500 stocks stand above their 200-day moving average, compared to 63% in September 2007 and 20% in February 2000. Do keep an eye on this indicator if it drops below 75% within the next 4-6 weeks as this would signify a clear negative breadth divergence.
Fed Remains on a High
For the first time in history, US central bank policy is at its most aggressive mode while stocks are at their highest levels. Most notably, the Fed has signaled it is in no hurry to withdraw its stimulus. Now that Fed has de-linked tapering from any rate hikes, the notion of reducing asset purchases may not necessarily be negative for equities. And what was an unemployment threshold of 6.5% for raising rates has now become a threshold of “considerably below 6.5%” before rate hikes are considered. This further supports the notion that interest rates will not be raised before the end of 2015.
Rather than asking whether stocks are due for a sharp decline, the question is how long is the next price consolidation before the next move up? While a move towards 1850 remains viable, we must closely watch the PE as it nears 17.6, book value nearing 2.9 and the 200-DMA breadth nearing 80%.


