Falling NYSE Margin Debt not yet a Sell
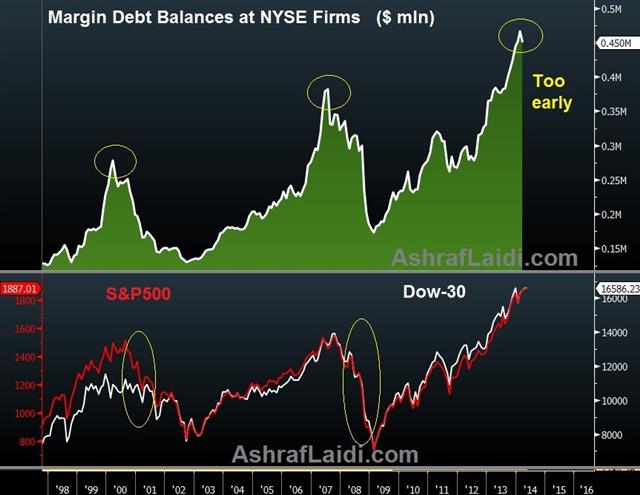
The increasingly important statistic released by the New York Stock Exchange on month-end margin debt by NYSE-member firms is drawing notice after revealing the first decline in eight months. Balances fell 3% to $450.3 bln in March, following eight consecutive monthly gains.
The chart below highlights the relationship between margin debt and stock market performance, as measured by the S&P500. The peak in margin debt seen in March 2000 coincided with the high in the S&P500, but in 2007, the peak in margin debt occurred in July, three months prior to the pre-crisis record highs in equities.The data suggests the close correlation reflects the increasing use of debt in purchasing stocks by institutional and retail investors, thereby, sheds particularly important light on the circular loop between price performance and the use of margin debt.
Timing and data interpretation
Traders must bear in mind the NYSE statistic is released with a 1-month lag, thus, the March data is out at end of April. Using the example of spring-summer 2011 when stocks fell 22% from their May peak to their October bottom, margin debt turned negative in May 2011, but the data wasn't available until end of June, by which time had dropped 8% before rebounding an impressive 7% only in the first 10 days of July. Yet, the margin data did predict the extended sell-off to follow as it fell in the ensuing 7 months before turning around in in January 2012.
May 2012 sustained a 10% decline in stocks, which was correctly reflected in a 6% decline in margin debt, but such figures were available in end of June, well after the selloff bottomed out. Sep-Nov 2012 sustained a 9% decline in the S&P500, but margin debt continued to grow for eight straight months until March 2014.
How I used margin debt in January 2008 and October 2008 to forecast further damage in equities
Margin debt can best be utilized for continuation patterns during selloffs rather than timing of turning points. In January 2008, I used the balance figures against the S&P500 to predict additional 25% declines after equities had already fallen by 14%.
Then in October 2008, as stocks had plunged 25% from their 2007 peak, we remained negative on stocks to the extent of predicting further Fed easing against the prevailing market consensus, which leaned towards US rates reaching a bottom at 2.0%.
Looking ahead, equities technical are not anywhere near the dangerous territory seen in summer 2011 or 2007-8 despite doubtful fundamentals. Earnings valuations may be higher than historical averages while earnings growth has clearly tapered off. But making the “day of reckoning” trade prematurely may trigger a self-fulfilling reckoning to trading accounts instead of the market.


