Gold Bullion & Miners' Race to the Bottom
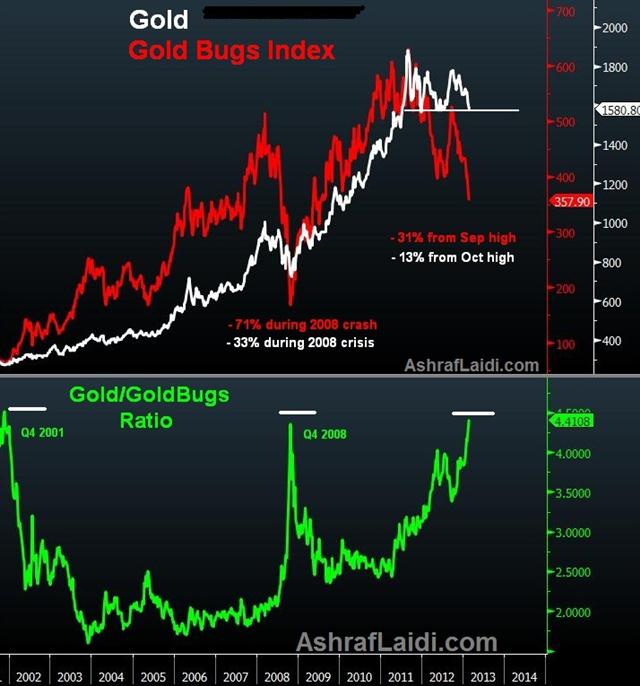
Since equities had reached bottom in June 2012, major indices have rallied 21% to today, compared to -1% for gold bullion and -20% for the Gold Bugs index – An index of the 16 most popular gold mining companies.
The Gold Bugs index has fallen 31% from its September high, while the yellow metal dropped 13% from its October high. A similar 2.5-1 disparity in GoldBugs-Bullion Sell-off was seen during the 2008 crisis, when bullion fell 33% from its 2008 peak to its 2008 trough, while Gold Bugs fell 71% during the same period.
And for an idea about the extent to which gold has outperformed gold miners, the price of bullion is now more than four times the Gold Bugs ratio, the highest in 12-year highs, nearly doubling from its 2011 lows and breaking above the highs from 2008.

Over the years, many investors have preferred miners over bullion with the rationale that stocks carry intrinsic value of capital appreciation, dividends, management performance and the potential of positive rates of returns exceeding cost of capital. But miners have delivered their share of disappointment. Underestimating cost overruns, the inability to contain soaring production costs and over concentration on boosting output to chase rising price of bullion have proven damaging to share prices. Multibillion-dollar takeovers in the red and labour unrest in Africa have also delivered their share of force-majeure risk, to the very asset, which was meant to hedge against risk.
Gold's outperformance relative to miners stemmed from investors' seeking capital gains in bullion as central banks' quantitative easing sent yields plummeting and boosted inflation expectations. Recurring market panics on Europe and the periodic delaying of budget resolutions by US Congress have also maintained support for precious bullion.
But gold is now getting all the wrong attention amid commodity funds' selling their multi-year holdings and the breakdown of key technical dynamics hit the headlines:
i) Gold's 55-day moving average broke below the 200-day moving average;
ii) Gold is posting its first back-to-back quarterly decline since 2000;
iii) Gold breaking below its 100-DMA for the first time since 2008;
iv) and soon (possibly but not yet in the headline), Gold's 55-WMA may fall below the 100-WMA for the first time since… 2002.
Gold's next downside target stands at 1520-25, a break of which may further trigger stops of CTAs & black box positions. A print of 1500 is seen almost synonymous with the road to 1330, which may well become the trigger for the Gold-GoldBugs ratio to peak & chart its next descent.
For tradable ideas on FX, gold, silver, oil & equity indices get your free 1-week trial to our Premium Intermarket Insights here
Follow us on Twitter @Alaidi


