Parameters in Equities, Oil
Parameters in Equities, Oil
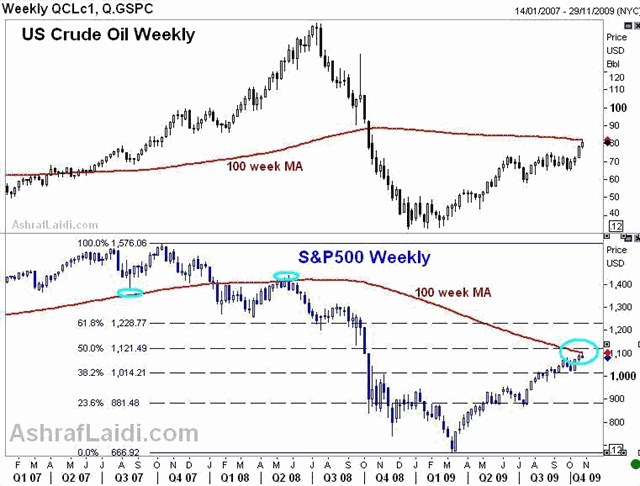
Last week's oil price break above $75 was an essential catalyst in accelerating the pace of USD selling beyond $1.50 in EURUSD, 0.93 in AUDUSD, and 1.03 in USDCAD. Technically, the next oil barrier emerges at $82.00 (100-week MA), a break of which would extend the rally towards $89.90. Coincidently, US equity indices also face their next resistance at the 100-week MA (1,100 for S&P and 10,209 for the Dow). But a more important landmark for the S&P500 stands at 1,121, which marks the 50% retracement of the decline from the October 2007 high to the March 2009 low.
Recall how oil prices repetitively failed to break its 200-week MA of $75.70s in August and September until recurring dollar weakness (hawkish central bank outside US) empowered oil traders to breach the key level. The simultaneous technical resistance in both of these high profile instruments (US crude and S&P500) may well dissuade the accumulation of fresh risk appetite. And Wednesdays downgrade of Wells Fargo may have been instrumental in stepping up trading volumes in a down day. But the only viable means for dollar bulls to see hope again is the implementation of the exit strategy. Short of such implementation, earnings disappointments and/or negative guidance, FX traders will see little resistance to selling the dollar.

Fed Ought to Stop Talking About the Dollar
Federal Reserve officials should either get the same vigorous training when making statements about the US dollar or completely refrain from taking about it, and allowing the US Treasury exclusive authority to comment on the currency.
For the second time this week, a member of the FOMC causes more selling in the dollar after choosing to shed light on the US currency to the public. 30 minutes ago, Boston Feds Eric Rosengren (not a voting member in this years FOMC) said the decline of the dollar reflected investors improved confidence with the economy and their resulting appetite for risk. While such remarks are no more than a stating of the obvious as far the current FX market dynamics, they constitute an overt green light to sell the currency, especially when uttered by policymakers of the interest-rate setting body of the US.
On Monday, Chairman Bernanke may have intended to support the dollar when he raised the importance of timely exit strategy, but the way he went about it had the opposite effect. Bernanke said adopting a fiscal exit strategy "is critically important in order to maintain confidence in our economy and confidence in our currency". So far, the Fed has made it clear it would not be exiting its monetary policy strategy any time soon (aside from talk about reverse repos). Bernanke's speech placed the onus on the Treasury as far as fiscal policy is concerned.
And since fiscal tightening by the US Treasury is not expected any time soon, traders easily conclude that the lack of any exit strategy (fiscal or monetary) will empower them to retest last year's all time lows in the greenback.


