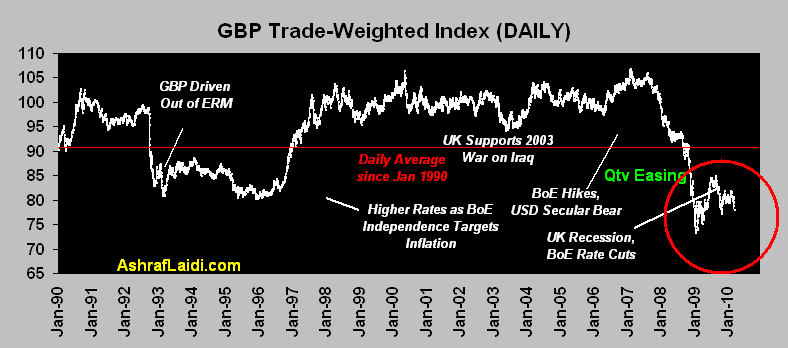
GBP Trade Index 18-Year Chart

Sterling's trade-weighted index hit a 12-year low in November 2008 when measured against a basket of currencies. The index incorporates various bilateral exchange rates, reflecting changes in the price competitiveness of traded goods and services and trade flows in manufactured goods and services. Country weights are updated annually and are determined by the average share of UK imports/exports over the latest three year period as long as it exceeds 1%. The base 100 value is set from January 2005. Weights were last determined in September 2008.
The basket currently comprises 46 countries, with the main components as follows; USA at 16.1%; Germany at 12.5%; France at 9.4%; The Netherlands at 6.6%; China 5.9%; Belgium and Luxembourg at 5.9%; Italy at 4.7%; Japan at 4.3% and Switzerland at 2.9%.


