US EU Bond Yield Spreads
Adding 10-year Spreads to the Mix

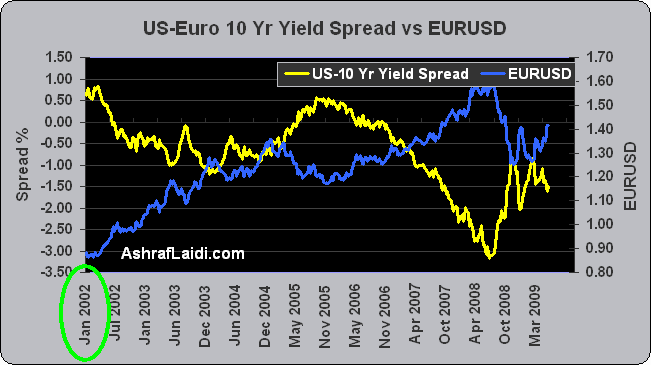
Rather than simply comparing currencies' overnight interest rates, FX traders pay close attention to differentials in 10-year yields for the market's assessment of longer term interest/inflation rate horizons. The relationship is straight forward. Currencies with a widening yield differential tend to appreciate versus their lower yield counterpart. The above chart shows EURUSD bottoming at $1.1715 in December 2005, nearly 2 months after the US-Eurozone 10-year spread peaked out at 0.55%. Fundamentally, the peak occurred when the ECB signaled the beginning of its tightening campaign, which ultimately took place in December. The US yield spread had accelerated around October 2004, once the Federal Reserve became increasingly expected to prolong its tightening campaign into 2005. But the U.S. yield advantage fizzled as the ECB began raising rates while the Fed's rate hikes were considered nearing their end. Identifying turnarounds in 10-year spreads enables a crucial advantage in currency markets.
Euro’s Breakdown in Line with Yield Spread Spike

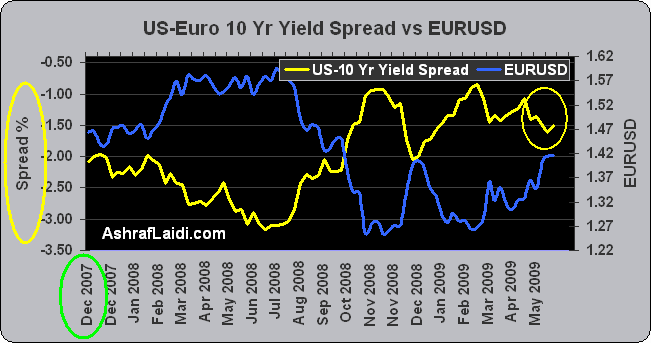
As EURUSD intensified its decline and broke below the major $1.47 support in mid August from its $1.6035 record high of mid July, the U.S. 10-year yield rapidly shrunk the deficit with its Eurozone counterpart from -3.20% to -2.32%. The $1.45 level in the euro is considered mainly psychological, but the $1.4360 point is a key technical foundation, representing the 38% retracement of the 1.1640-1.6035 move. This level corresponds near the -2.00% mark on the US-EU 10 yr yield spread, which is the high for the year.


