Intraday Market Thoughts Archives
Displaying results for week of Dec 16, 2018Slowdown or Recession?
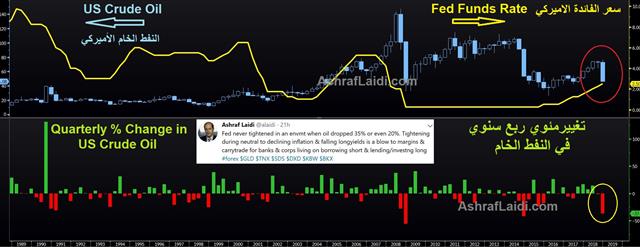
Economic data so far is showing nothing worse than a modest slowdown in global growth but markets are acting as though a recession is on the horizon. Both cannot be right. Here are three spots to watch for early signs and a chart from Ashraf indicating how the Fed's policy mistake could occur this time around.
China data
Everyone has been worried about China for nearly 15 years. The growth has been unlike anything seen in history and the smooth pace is one of those things that's felt too-good-to-be-true for a long time. Could this finally be the first real test?One problem is that data can't be trusted. It's been manipulated forever. Guangdong abruptly stopped publishing its economic survey in October after five straight months of declines. Officials said the regional industry office didn't have approval from the stats bureau.
One area that can't be faked is trade data. That's because it's reported for China and in the trade partner and the numbers need to match up. Especially watch imports as they're more forward looking than exports. In November, imports rose just 3.0% y/y compared to 20.8% in October and 14.0% expected.
Trade war data
Central bankers have been remarkably arrogant around trade risks. Yesterday Powell talked about their models around trade and that the impacts weren't big but that it could damage sentiment. Poloz has been saying the same.I don't believe you can model it and historical evidence is hard to come by. We just don't know businesses and the real economy are going to react. The key variable is stockpiling. Trump has been talking about tariffs all year and that may have led to a hidden buildup in inventories. As tariffs hit in September, we might see an inventory drawdown, which could curb growth. At the same time, you have Trump threatening 25% tariffs on everything so – as a business – you're continuing to accumulate and stockpile. Eventually though, you hit the cliff.
Signs of trouble will be in trade data and manufacturing surveys. Yesterday's release of the Philly Fed dropped to the lowest since 2016. The NY Fed's Empire index is at the lowest since March 2017
Capex data
Business investment is a leading indicator. Unfortunately core US durable goods orders have been negative for the past four months. Look out for commentary from corporate leaders. Earlier this week, Fedex warned about slowing global growth, particularly in Europe. More comments along those lines would severely undercut sentiment. The risk is that companies use it as a scapegoat for poor execution.Yen Index far from Overbought
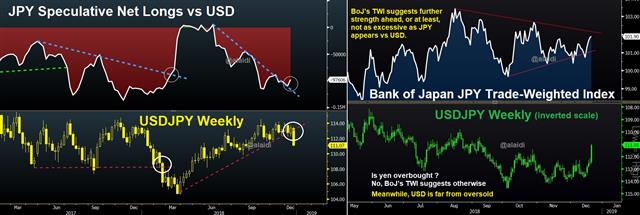
So much talk about the USD index, but what about the JPY index from the Bank of Japan? What does it show? How is JPY positioning vs USD among CME speculators. Here's a look at JPY TWI vs JPY positioning. Full analysis.
Fed Stands Ground, Bears too
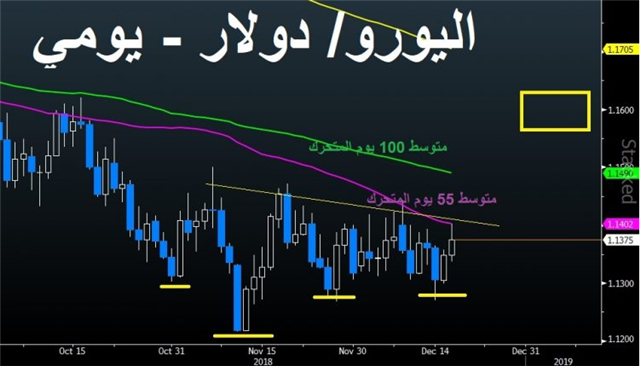
The FOMC hiked rates for the fourth time this year in a move that was mostly expected but in statement that emerged less dovish than the dot plot forecasts. The downward impact on equity indices was greater than the upward impact on the USD. Now USD is lower across the board and indices off the Asia lows. Although the Fed signalled 2 hikes instead of the expected 3, Eurodollar futures (see chart) below are pricing rate cut for 2020. The Dec Philly Fed index dropped to a 28-month low. The Premium long in gold finally hit its final target at 1253, while the DOW30 was stopped out. Both of the USDJPY and EURUSD Premium trades are deepening in the green.
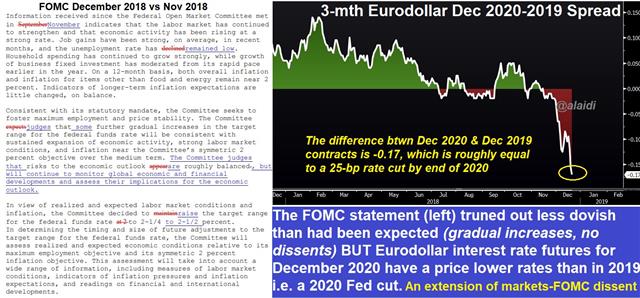
Equally important was the message about what's coming next. On that front, the Fed retained more of a hawkish bias than the market would have liked. The statement said 'some' further hiking would be needed, a hint that hikes will be limited but aren't done. They also highlighted risks.
QT vs Rate Hikes
In his press conference Powell noted rising 'cross currents' and said the Fed can be patient going forward but he also took pains to emphasize the justify hikes. But why did indices accelerated their selloff? The main reason was Powell's indication that the reduction of the Fed's balance sheet (Quantitative Tightening) will remain on auto pilot, which was compounded the market's tightening fears following the 2 hikes signalled by the dot plot. The Treasury yield curve flattened with 2s10s now just 10 basis points from inversion, while the 3s5s briefy touched negative.Gold retreated towards 1242 before bouncing back to a 5-month high of 1261. Yields resume their downfall to a hit an 8-month low of 2.74%, in a clear manifestation of bearish growth projections from bond traders.
Looking ahead, the market will turn its attention to global growth and trade. The question is how strong growth will be in 2019 with a particular emphasis on Chinese and European growth.
Some disappointment came early Thursday in the New Zealand Q3 GDP report. Growth was just 0.3% in the quarter compared to 0.6% expected. That sent the kiwi to a three-week low.
| Act | Exp | Prev | GMT |
|---|---|---|---|
| GDP (q/q) | |||
| 0.3% | 0.6% | 1.0% | Dec 19 21:45 |
إشارة السوق للفيدرالي
تتجه جميع الأنظار نحو قرار يوم مجلس الاحتياطي الفيدرالي(العاشرة مساءا بتوقيت مكة). هناك احتمال بنسبة 70٪ بأن يرفع الاحتياطي الفيدرالي أسعار الفائدة بمقدار 25 نقطة أساس، وهنا الأسباب التي ترجح بأن هناك فرصة كبيرة (أكثر من 60٪) بأن يكون تأثير هذا الإعلان سلبياً على الدولار الأمريكي وإيجابياً على الذهب التحليل الكامل
Oil Adds to Fed Intrigue
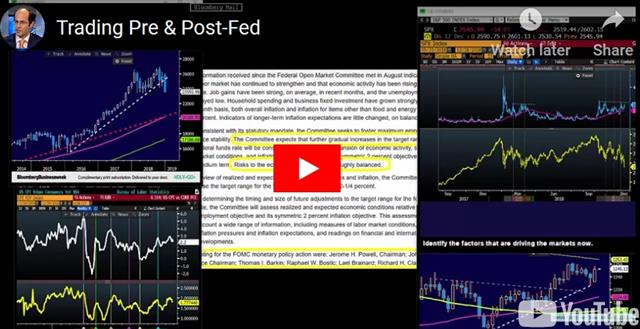
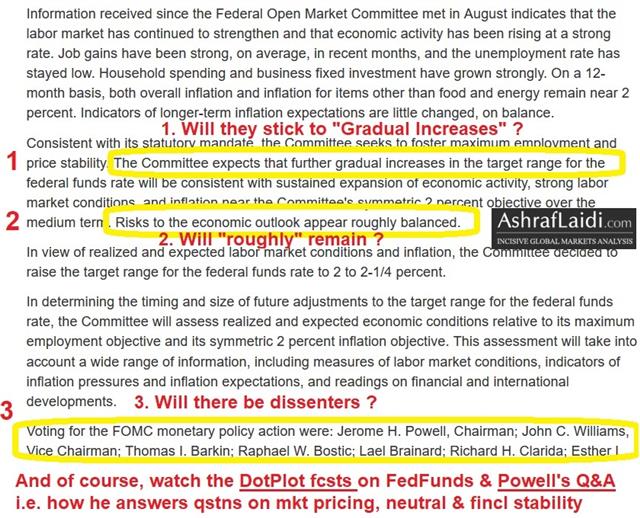
The collapse in oil prices resumed on Tuesday with prices now down 40% since October and 13% over the past three trading days. The New Zealand dollar was the top performer while the Canadian dollar lagged. The Fed decision looms. A new Premium trade ahead of the Fed decision was issued before the close of the NY session. The image below is the statement from the September rate hike, noting possible changes as a means of dovishness. A detailed video on pre & post-Fed trades has been posted for Premium subscribers on here.
We highlighted the fall below $50 in WTI as a key technical support breakdown, noting that it left little support until $42.05. It appears to be headed in that direction in a hurry with prices down $4 Tuesday to $45.91 as global growth fears mount. The market is voting that OPEC hasn't done enough and US inventories unexpectedly grew in the API report late Tuesday.
Risk trades in the currency market made some minor headway Tuesday but there was still plenty to be disappointed about. The S&P 500 had been comfortably higher but finished flat. After the close, FedEx cut its profit forecast on slower global growth and that rattled sentiment. They pointed to soft business outside of the US and weakness in Europe in particular.
The drop in oil is an added wrinkle for the Fed and may help to give them cover for an immediate pause or a dovish signal such as the reference to inflation mentioned in the image above. With Wednesday's decision looming the odds of a hike are down to just 64%, setting this up as one of the most uncertain meetings in two years. Through 2019, there's only a 35% chance of another hike.
What the vanilla pricing doesn't show is tail risk. The market is understandably jittery right now and the modest pricing for Fed hikes in 2019 doesn't capture the risk – however minor – that the Fed could stubbornly continue to forecast and signal hikes.
At the same time, the Fed is limited in exactly how it can send signals. There will be no line in the statement saying 'we're going to pause' and the Fed will want to retain some flexibility if markets rebound. The drop in oil is certainly deflationary and the Fed could argue that it also puts downward pressure on inflation expectations. This and trade worries could tilt the balance of risks to the negative side. A number of dissents in favor of no hike would also send a dovish message, as could the dot plot or something in Powell's press conference.
If the decides to immediately pause, it's not entirely clear that risk trades will jump. If the Fed isn't careful about the wording, the message could be interpreted as the Fed seeing a quicker slowdown in the economy.
Keep a close watch on gold. It's testing the December high and a surprise pause or dovish message would send it higher. There is also a strong seasonal tailwind early in the year.
| Act | Exp | Prev | GMT |
|---|---|---|---|
| FOMC Press Conference | |||
| Dec 19 19:30 | |||
Risk Trades Calling Powell
Global equity indices are stabilising following Monday's 2% declines. Overnight, the S&P 500 touched below the February lows on fresh economic worries. Interestingly, The US dollar was among the big currency losers despite the stocks selloff with yen and gold rallying across the board. CFTC positioning showed yen shorts trimmed. The Dow30 Premium short was stopped out, forcing us to answer whether 22,000 or 25,000 ? Ashraf has issued a new Premium video highlighting the striking developments between the DOW30 and S&P500 to make his argument for the Fed outcome and upcoming Premium trades on FX and indices.
The S&P 500 hit the lowest since October 2017 in a 2.1% decline Monday. The selling came as a flood midway through the day after the index had been flat.The S&P500 broke below its 100-WMA, while DOW30 held above its 100-WMA. Both indices are down 13% from their autumn highs.
Reasons for worry included economic data. The Empire Fed fell to 10.9 from 20.0 which is the lowest since May 2017. Worse was the NAHB housing market index as it sank to 56 compared to 61 expected; two months ago it was at 67.
USD/JPY skidded to 112.25 from 113.30 as the pain ratcheted up in markets. Still, the pain in FX and bonds wasn't at the level of stocks, where the weakness is likely exacerbated by fund redemptions and year-end flows.
Technically, the bigger breakdown than stocks may have been oil. WTI had been trying to form a bottom above $50 but it fell 4% Monday to $49.13 and that leaves little support until $42.05.
CFTC Commitments of Traders
Speculative net futures trader positions as of the close on Tuesday. Net short denoted by - long by +. This week's report was delayed because of the US holiday.EUR -56K vs -61K prior GBP -42K vs -40K prior JPY -98K vs -110K prior CHF -18K vs -20K prior CAD -12K vs -13K prior AUD -46K vs -51K prior NZD -15K vs -21K prior
The moves were modest with the general theme a paring of US dollar longs. That could reflect position squaring ahead of year-end or of worries about the Fed. Overall, the market is still heavily long US dollar even against risk proxies like CHF and JPY.
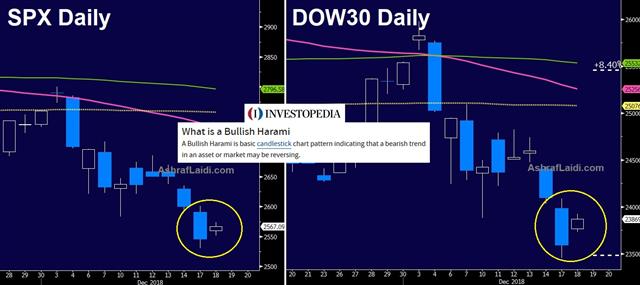
Ashraf Tells me about the Bullish Harami
| Act | Exp | Prev | GMT |
|---|---|---|---|
| NAHB Housing Market Index | |||
| 56 | 61 | 60 | Dec 17 15:00 |
ندوة مساء اليوم مع أوربكس
تابعوا أشرف العايدي بندوته الإلكترونية القادمة لإستيعاب كيفية تداول آخر لقاء للفيدرالي في 2018 قبل لقاء المركزي_الأميركي الحاسم بيوم. انضموا لنا اليوم 18 ديسمبر 2018 الساعة 10 مساءاً السعودية
للمشاركة من خارج السعودية
للمشاركة من السعودية فقط


