Intraday Market Thoughts Archives
Displaying results for week of Aug 02, 2015Stocks, Bonds, USD: What Rate Hike?
The US July jobs report was strong, or at least clearly better than the June report. 215K in NFP, 2.1% average hourly earnings y/y, unemployment rate unchanged at 5.3% and the participation rate also unchanged at 62.6%. The big rally in the US dollar was completely eroded, with EURUSD clawing back all of the 120-pips it lost immediately after the release. The only currencies not to end higher against the USD were CHF (due to renewed SNB jawboning), CAD (disappointing CAD jobs) and GBP and SEK.
Yields fall for 4th straight week
Our interpretation of the US jobs report is that it is strong enough to open the door open for a September rate hike (in the event that August figures are strong across the board), but not sufficiently strong to eliminate the debate, and thereby maintaining the probability for the Fed to hold in September and wait until December, for which more data will be required.Consequently, US bond yields fall for the 4th straight week, testing below their 55 and 200-week moving averages. The 2.15% support should likely hold for now, but if the bond market is supposedly pricing higher chances for a September hike, then falling yields imply either the bond market does not agree, or/and it is anticipating slowing growth and weakening inflation ahead.
And what would happen to the existing bullishness in bonds by speculators, highlighted in our piece from earlier this week.
Into the weeklies for stock indices
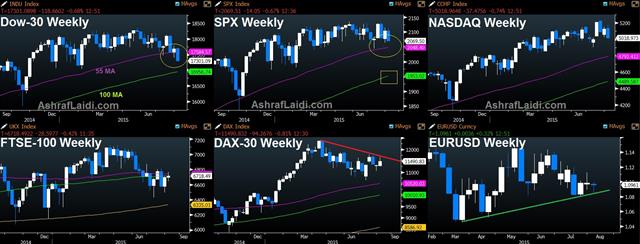
It's time to ignore the daily chart and turn to the weeklies for the Dow Jones Industrials Index and S&P500. While the S&P500 retests its 200-DMA, the DJIA has already fallen below both its 55 and 200-DMA, trading 3.0% below the 200-DMA, the farthest away since November 2012—the year when Apple began a 45% decline off its highs. The DJIA is also already trading below its 55-WMA, dragged down by Chevron, Caterpillar, Exxon and Dupont being the worst performer in the index over the last 4 weeks.Whether this means the next stop in the S&P500 is 2048, or the next stop in the DJIA is near its 100-WMA at 16,956, remains to be seen. Interestingly, both levels correspond to key levels of support. As long as hawkish members of the Fed continue to hint at rising odds of an autumn rate hike, stocks will not be helped.
This month will be filled with muscle-flexing speeches from most FOMC members. And stock won't like it.
| Act | Exp | Prev | GMT |
|---|---|---|---|
| Average Hourly Earnings (JUL) (m/m) | |||
| 0.2% | 0.2% | 0.0% | Aug 07 12:30 |
| Average Hourly Earnings (JUL) (y/y) | |||
| 2.1% | 2.3% | 2.0% | Aug 07 12:30 |
| Unemployment Rate (JUL) | |||
| 5.3% | 5.3% | 5.3% | Aug 07 12:30 |
مقابلتي على سي أن بي سي بعد بيان الوظائف الأميركي
مقابلتي على سي أن بي سي بعد بيان الوظائف الأميركيالمقابلة الكاملة
Click To Enlarge

نحو المركزي الإنجليزي و الوضاءف الأميركية
Services ISM Soar, ADP Disappoints
USD recovered from a disappointing ADP reading to rally across the board when the headline July services ISM hit a 10-year high of 60.3 from June's 56.0. The employment component soared to a 10-year high of 59.6, posting the biggest monthly increase in the history of ISM/NAPM report.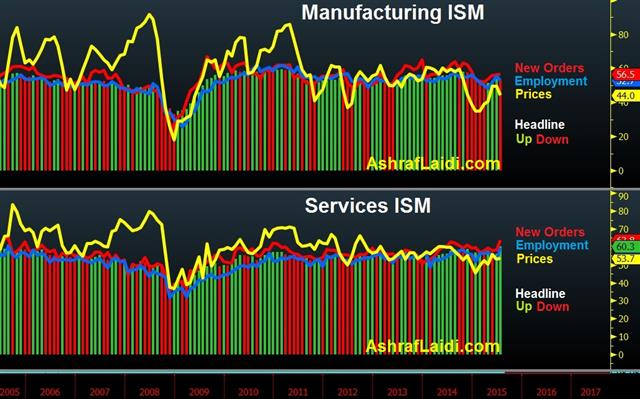
The prices paid component extended further into expansion territory. Rising to 53.7 from 53.0, in contrast with the decline in the manufacturing ISM prices paid index, which deepened into contraction territory at a 4-month low of 44.0, reflecting the collapse in commodities.
2005 was the last year for such a powerful services ISM as well as a US dollar bull market boosted by a tightening Fed.
Earlier today, July ADP slowed to 185K from June's 229K, posting its weakest level in 4 months. Interestingly, the reaction was muted as bond yields pushed higher alongside US stock futures, implying that report may dissuade the Fed against a September rate hike. But the breadth of the improvement in the services ISM, reviving odds of a September hike to 50-50.
Interestingly, the rallying US dollar dragged down oil prices (which were temporarily lifted by another draw in EIA crude oil inventories (-4.4mn), this time the biggest in 6 weeks. As US crude oil hit a new cycle low of $44.88 and Brent hit a 7-month low of $49.02, big energy shares weighed on the major averages.
Ahead of "Super Thursday"
Before we approach the all-important NFP report and those average hourly earnings, traders turn to “Super Thursday”, as the decision of the Bank of England, the minutes of the decision and BoE's Quarterly Inflation Report are simultaneously released at Noon BST. GBP reaction will be divided between the minutes and the inflation outlook in the report. We expect the minutes to show a 8-1 vote in favour for rates to remain unchanged, but the identity of the dissenting member will be crucial. As long as there is at least one dissenter, this should help keep GBP supported despite any dovish leanings from Carney. Our existing Premium trades include GBPUSD, EURUSD, USDJPY, USDCAD and AUDCAD.| Act | Exp | Prev | GMT |
|---|---|---|---|
| ADP Employment Change (JUL) | |||
| 185K | 215K | 237K | Aug 05 12:15 |
| ISM Non-Manufacturing Composite (JUL) | |||
| 60.3 | 56.2 | 56.0 | Aug 05 14:00 |
| Employment Change s.a. (JUL) | |||
| 15.0K | 7.3K | Aug 06 1:30 | |
| Fulltime employment (JUL) | |||
| 24.5K | Aug 06 1:30 | ||
| Part-time employment (JUL) | |||
| -17.2K | Aug 06 1:30 | ||
| Unemployment Rate s.a. (JUL) | |||
| 6% | 6% | Aug 06 1:30 | |
Apple's Triple Break
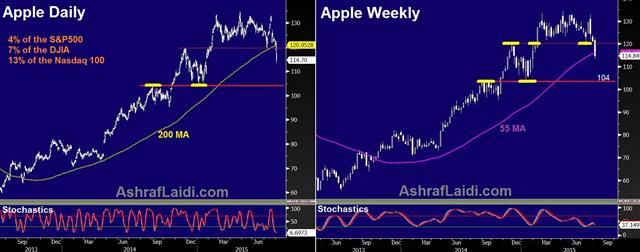
On the week Apple shares fell below their 200-week moving average for the first time since September 17, 2013, they also fell below their 55-week MA for the first time since October 2013. Apple has also lost 7% over the last 30 days, underperforming 25 of the 30 shares in the Dow Jones Industrials Average. The stock makes up 4% of the S&P500, 13% of the Nasdaq 100 and 7% of the DJIA.
The 30-member DJIA has now traded below its 200-day MA for 9 consecutive days, longer than the 8-day period during the fateful week of mid-October 2014-- the longest period since November 2012. 2012 was also the year when Apple peaked in September of that year before falling a remarkable 45% over the ensuing 7 months, losses attributed to slowing growth for iphones and rising competition from Samsung.
The China story remains the most popular scapegoat for a rapidly growing company in need of persistent momentum growth The $4 trillion wiped out over the last 7 weeks from China's stock market will be difficult for Chinese retail investors to regain. A Chinese soft landing is highly probably, but a 30% decline in the Shanghai Composite index in a matter of three weeks –leveraged—will eat into wealth for a long time. Any rebound is likely to be capitalized on by fund managers and Chinese smart money than by retail traders.
We expect 2,069 and $105 to be the next target for the S&P500 and Apple shares. Until we get there, the China story is unlikely to have changed, but the ever-developing plot of Fed hike expectations ought to be revisited.
Treasury Positioning at Odds with Fed Hike
Why is positioning in US 10-year treasury notes at its most bullish levels in 27 years despite several FOMC members calling for at least one rate hike this year?
The latest positioning figures from the CFTC show longs exceeding shorts by 65,642 contracts, the biggest net long position since May 2013. Such growing bullishness on the 10-year treasury is consistent with the 5-week decline in bond yields, which coincided with plunging oil prices.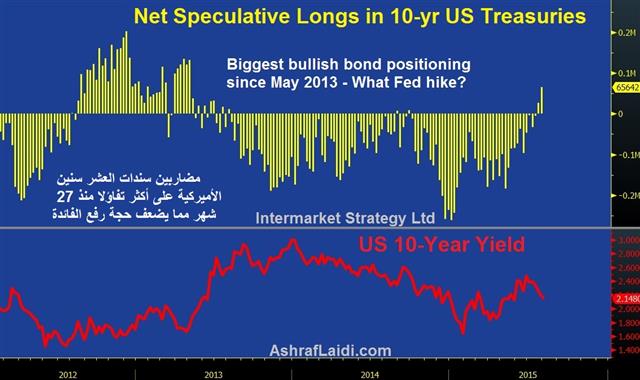
Ten-year treasury yields are testing the crucial 6-month trendline after breaking below the 200-week MA. A break below 2.08% this week should invite bond bears to further selling, until the psychological 2.00% is likely to hold.
Today's weaker than expected US reports on Jul ISM manuf (52.7 from 53.5), prices paid (49.5 from 44.0), employment (52.7 from 55.5) and June construction spending (0.1% from 0.8%) are not sufficient to remove the case from the Fedhike camp after core PCE rose to 1.3% in June.
But taking a look at speculative positioning among bond traders might give us an idea about forward-looking trades. Last week's release of record low ECI q/q has diminished odds for a Sep hike for now. The negative impact of tumbling oil on stocks and the economy outweighs the windfalls to consumers and non-energy companies, which explains the clearly direct relationship between yields and oil prices. This point is hugely debatable, but the capex realities between energy and non-energy firms as well as the use of cash for buybacks helps explains those implications.
Friday will reveal the crucial release of NFP and average hourly earnings, which will be followed by the latest Fed pronouncements at the Jackson Hole symposium later this month, before the August NFP is released on Sep 4th. Meanwhile, speculative positioning among treasury speculators should be added to your watch list.
| Act | Exp | Prev | GMT |
|---|---|---|---|
| Construction Spending (JUN) (m/m) | |||
| 0.1% | 0.6% | 1.8% | Aug 03 14:00 |
5 Currencies' Positioning in 1 Chart
Combining the net speculative futures positions of all 5 major currencies against the USD, we find CHF positioning to remain the only net long against USD, ever since the SNB decision end its EURCHF peg in January. GBP positioning is the only currency to show steady improvement against USD. Currency-by-currency analysis below.
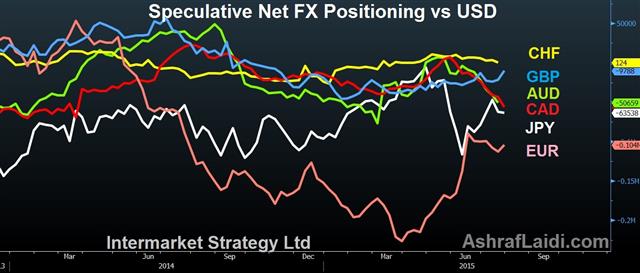
Net longs in CHF vs USD have gradually eased since reaching 10-month high in early June.
Net speculative GBP hit the lowest net short (least negative) positioning since November, at 9,788 contracts. This week's release of the BoE quarterly inflation report shall prove crucial in tipping the balance closer to net long positioning, with most traders expecting at least one member of the BoC's MPC to vote for a rate hike this week.
CAD net shorts undergo the worst deterioration among all currencies, with 56,067 short contracts exceeding longs, the biggest net short balance since March 2014. This is a classic case of a central bank throwing the towel over tumbling oil with two rate cuts in 6 months as GDP shrank in five consecutive months, a pattern last seen in 2009.
AUD net shorts are a close 2nd to CAD deterioration as deepening erosion in the nation's mining sector force the RBA to keep the door open for further easing despite rapid Aussie depreciation. Each dead-cat bounce in Chinese equities is becoming a new reason to sell Aussie dips.
EUR net shorts continue their long and slow rebound, with US macro dynamics taking centre stage as Greece issues are pushed aside. EURUSD futures trading is the biggest in the IMM currency complex as the pair is the most heavily traded in the $5.3 trillion spot market. The pair also remains used as a proxy for the USDX.
JPY net shorts increased for the 2nd straight week after having diminished steadily throughout June and most of July. With global equities fixated at the uncomfortable combination broadening energy damage and a US central bank flirting with tightening, JPY speculators are incapable to tread far away from the safe haven route.


