Intraday Market Thoughts Archives
Displaying results for week of Sep 27, 2015Payrolls Shock is Wakeup Call to Hawks & USD Bulls
The US September jobs report deals a significant blow to the notion of a 2015 Fed hike--against which we consistently disagreed throughout the year – as it achieved the gloomy feat of disappointing across the board -- headline rate (first back-to-back months of sub 200K in 18 months), downward revision in prior months (-59K), notable decline in average hourly earnings, and the unchanged unemployment rate was offset by the decline in the participation rate to a fresh 38-year lows.
Especially sobering about this report is just when the Fed had been increasingly shifting attention towards slowing inflation metrics under the assumption that labour market metrics will continue improving, this happens.
The door to Fed lift-off has been shut beyond Q1 2016 as the extended weakness in the world's biggest buyer of commodities, combined with the erosion of the “Gulf Nations' Put” as well as the decline in EM FX reserves is a de facto tightening of equity and bond markets.
China and EM have done the Fed a huge favour by saving it from committing a monumentally embarrassing rate hike, against which we warned in our Sep 28 note:
“The rate of deterioration in the debt profile of energy and mining companies is far from that reached by sub-prime lenders in 2007-2009. But the situation is getting worse. A Fed hike would be a costly and embarrassing policy error".
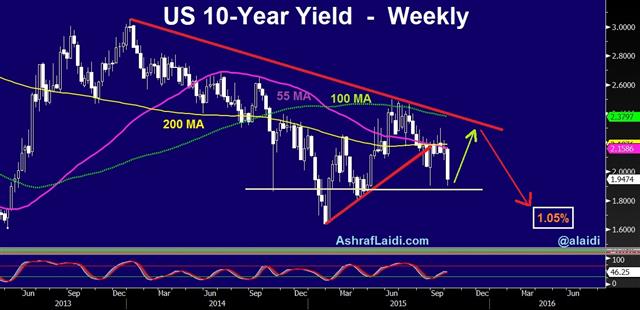
US 10-year yields have extended losses below the all-important 200-day moving average as well as the 55-200 WMA confluence, but we expect gradual stabilisation to ensue near 1.87%, before rebounding to as high as 2.25% later this quarter. Escalating worries of a unsustainable EM debt and a global recession in late Q1 will force bond yields back below 1.90%, until we reach 1.10% in Q3 2016.
| Act | Exp | Prev | GMT |
|---|---|---|---|
| Average Hourly Earnings (SEP) (m/m) | |||
| 0.0% | 0.2% | 0.4% | Oct 02 12:30 |
| Average Hourly Earnings (SEP) (y/y) | |||
| 2.2% | 2.4% | 2.2% | Oct 02 12:30 |
| Unemployment Rate (SEP) | |||
| 5.1% | 5.1% | 5.1% | Oct 02 12:30 |
Hurricane Heartbreak for Oil Bulls
We take a closer look at the US oil supply story today after a $2 whipsaw on crude prices as Hurricane Joakim approaches New York. The Canadian dollar got a boost from crude and was the top performer while CHF lagged. Australian retail sales are next.
Forecasts showing Joakim headed towards New York harbor early next week boosted crude early in the day and then new forecasts showing it moving further North reversed the trade. The oil market has a history of kneejerk reactions to temporary supply disruptions from storms but they should be used as opportunities to sell because the dynamics of the US market have changed.
A decade ago, much more of US oil was imported via the Gulf of Mexico, which is always vulnerable to hurricanes. There is a heavy offshore drilling presence there as well. But two factors have made the US oil market far less vulnerable to what happens in the ocean. 1) The rise of Canadian oil exports 2) The explosion of US shale. Storms have virtually zero impact on that production so for the foreseeable future, Hurricane-driven spikes will be opportunities to sell. Premium subscribers will obtain a special pre-NFP edition of the Premium Video at about 21:00 EDT (02:200 BST) to go through selected strategies, existing and new trades.
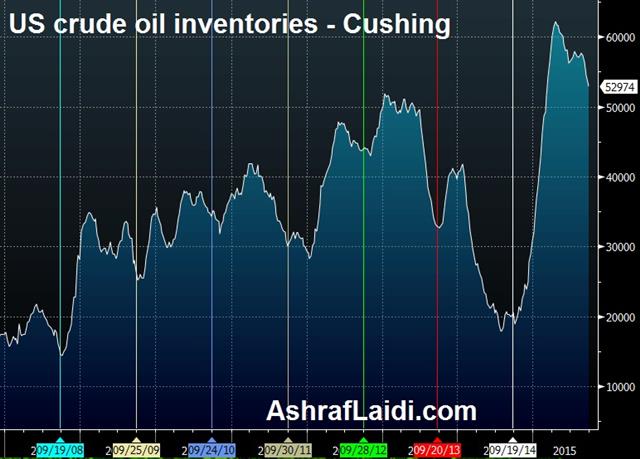
In the bigger picture, US oil storage supplies are virtually overflowing. This is the time of year that US oil supplies at the main hub in Cushing usually trough. As we head into October, refineries shut down for maintenance and to transition to more heating oil and less gasoline. But current supplies at Cushing exceed any pre-2015 point for the past 15 years.
Storage capacity will be maxed out in the coming months and crude will be dumped onto the market at any price. That has severe negative implications for the Canadian dollar and the latest bounce may prove an opportunity to sell.
In the short term, it's the Australian dollar in focus with retail sales at 0130 GMT and expected to rise 0.4%. Interestingly, October is seasonally the best month of the year for the Australian dollar and one of the worst for CAD.
| Act | Exp | Prev | GMT |
|---|---|---|---|
| Retail Sales (AUG) (m/m) | |||
| 0.4% | -0.1% | Oct 02 1:30 | |
180° in 50 weeks, it's different this time
A lot has happened since that fateful October bottom in stocks, which was driven by a multitude of factors namely, market worries over end of Fed QE and escalating casualties from the Ebola virus. But those were only worries and not factual manifestations of data weakness. Today, the extended weakness in the world's biggest buyer of commodities, combined with the erosion of the “Gulf Nations' Put” as well as the decline in EM FX reserves is a de facto tightening from in and capital markets.
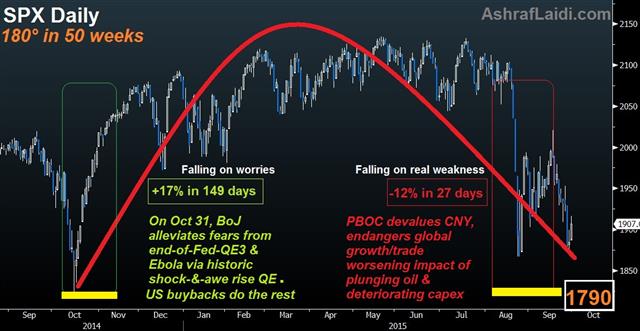
These are only some of the factors, which prompted a 180° downturn since the mid-October lows, dragging the S&P500 down 12% in a mere 27 days, following +17% in as many as 149 days from the October lows to the May highs.
As the market gradually makes its ways back to the October lows, it is important to contrast the situation between now and then.
Greater USD Fallout
The USD may have stabilised against the euro and yen, but in trade-weighted terms, it has gained an additional 14% against most major currencies since October, exacerbating the currency translation effect for US multinationals and increasing the price for US exports in the global market place. The situation is especially ominous when considering surging costs of USD-denominated loans in emerging markets, especially in Asia where the USD has risen 8% against a basket of Asian currencies since October. In China alone, more than $900 bln in USD-denominated debt remain unpaid. Not to mention the IMF warning about surging EM debt.Nearing Disinflation
Most market and survey-based measures of US inflation are lower than in October 2014. Unlike survey-based inflation measures, which are provided monthly, break-even rates priced off US inflation-protected bonds are available daily, with the 2-year BE tumbling near 8-month lows at 0.23% and 5-year BE rates at 1.1%, nearing its 6-year lows. These inflation measures have been criticized for being too sensitive to oil prices. But the Fed now risks being behind the curve in pre-empting deflation as real yields surge.No Magic from BoJ, ECB
Two weeks after global yields and share prices plummeted in midOctober, the Bank of Japan surprised the world with a rare split 5-4 decision in its policy board to accelerate the monthly purchases of Japanese government bonds so that its holdings increase at an annual pace of 80 trillion yen. Two weeks later, the European Central Bank signalled to markets that quantitative easing and negative interest rates would finally be pursued.Markets' reaction to these events was a 2-month rally in global shares, which eventually stalled in January 2015 as the New Year gave its first hint of impending deflation.
China Devaluation = Antithesis of ECB, BoJ QEs
China today is far weaker than it has ever been over the last 15 years. Most services and manufacturing surveys indicate a contraction, while exports have declined for the 5th month over the last seven months, driving down currency reserves to two-year lows. Tying the yuan to the rising USD has worsened the situation since October.Last month's CNY devaluation may have been a slight stimulus for China, but its impact on the rest of the world is the antithesis of QEs from the BoC and ECB. And once again, do not forget the disappearance of the MidEast out after reports that Saudi Arabia's Monetary Authority has withdrawn as much as $70 bn over the past six months. If you thought injections from MidEast and FarEast SWFs were instrumental in stabilizing global markets in 2007-9, then contemplate the reverse effect of these flows as Saudi Arabia and Qatar consider selling (known as restructuring their portfolios) to withstand budget imbalances resulting from falling energy prices.
We expect the October low to be revisited, before it is taken out for the next leg in what will become a bear market.
What we Learned this Quarter
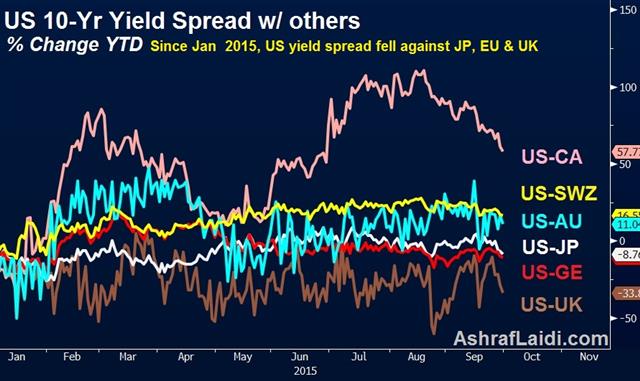
The quarter ended with more data suggesting the Fed won't hike this year. On the day, the commodity currencies led the way while the euro lagged. Up next, the Q3 Tankan survey kicks off a huge month for Japan. The chart below shows the fading US yield differential over six major currencies since the start of the year. Interestingly, the percentage change in the US 10-year yield over that of Japan, Eurozone and UK is now negative YTD.
Flow-driven trades were the story on Wednesday as the quarter wound down. Fund rebalancing helped boost the S&P 500 to a nearly 2% gain but the index was still down 6.4% in the past three months in the worst quarter since 2011.
Best FX Performers
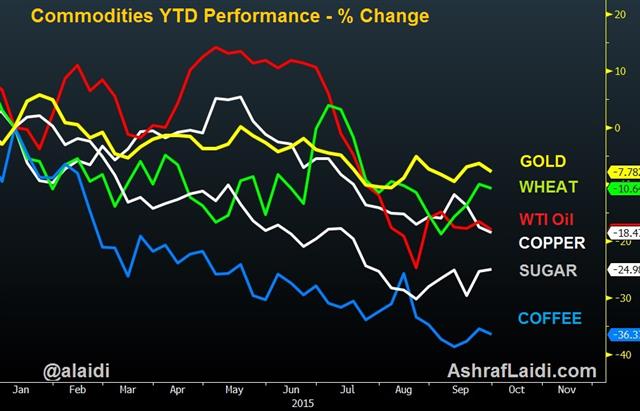
When we evaluate the quarter, the Fed was the most-talked-about event but the impact proved to have been overstated as the quarter progressed. The euro was the second-best performing currency this quarter, behind only the yen, narrowly edging over the US dollar.The big drivers are China and emerging markets. The Brazilian real fell by more than 20% in the quarter and worries about China led to wide stock market losses across the board. In turn, that sparked capital repatriation into USD and JPY.
One spot we're watching closely now is the pound. GDP numbers were a touch soft but the current account improved. In any case, cable has fallen for nine straight days but has nearby support at the May low of 1.5089.
Euro outperformance was another theme early in the quarter but it may come under fresh threat from soft inflation data. The ECB can afford to wait a few months and hope economic data improves but late in the year or early in 2016, they will be put under pressure to act.
But the central banks most in play at the moment are the RBA and BOJ. The IMF released a report warning about the potential for a hard landing in Aussie housing Wednesday and said Stevens has more room to cut if needed.
More from Japan?
JPMorgan was out with a report calling for the BOJ to unleash a new round of stimulus. The Japanese PM was talking about Abenomics 2.0 yesterday and the October 30 decision promises to be a big one. A major factor will be industrial sentiment and the best gauge comes today at 2350 GMT when the Q3 Tankan is released. The large manufacturer sentiment index is expected to slip to 13 from 15 while small manufacturing is forecast at -2 from zero. Ashraf has detailed the various paths of stimulus likely to be adopted by the BoJ as he makes the case for another trade in the latest Premium Insights.| Act | Exp | Prev | GMT |
|---|---|---|---|
| GDP (Q2) (q/q) | |||
| 0.7% | 0.7% | 0.7% | Sep 30 8:30 |
| GDP (Q2) (y/y) | |||
| 2.4% | 2.6% | 2.6% | Sep 30 8:30 |
| Current Account | |||
| -16.8B | -22.2B | -24.0B | Sep 30 8:30 |
| Tankan Large Manufacturing Index (Q3) | |||
| 13 | 15 | Sep 30 23:50 | |
| Tankan Large Manufacturing Outlook (Q3) | |||
| 10 | 16 | Sep 30 23:50 | |
| Tankan Non - Manufacturing Index (Q3) | |||
| 20 | 23 | Sep 30 23:50 | |
| Tankan Non - Manufacturing Outlook (Q3) | |||
| 18 | 21 | Sep 30 23:50 | |
عامل الخليج في الأسواق العالمية
Drawn and Quartered
Markets chopped but settled at a virtual standstill on Tuesday. The New Zealand dollar was the top performer while the Canadian dollar lagged and hit a fresh 11-year low. Japanese retail sales and industrial production are up next. Ashraf has a new 40-minute video for Premium subscribers, laying out the strategies and charting behind intermarket trades.
A 50-point drop in the S&P 500 on Monday had traders on edge and that's where they remained Tuesday. The major FX pairs finished within a quarter-cent of opening levels and stocks were fractionally higher.
Flows dominate at this time of year. Wednesday is the final day of Q3 and asset managers are squaring books and trades. Those flows overwhelm fundamentals.
The most-negative headlines hit the euro as German and Spanish CPI data was well-below estimates. The euro fell below 1.1200 for a period but slowly clawed its way back to finish slightly higher on the day at 1.1253.
Cable remains in a slump. It fell for the eighth consecutive day and hit a fresh low since early May at 1.5129. It was a marginal fresh low but the inability to bounce is a concern. Perhaps more concerning is that the entirety of the GBP skid is without any strong fundamental driver, aside from BoE warnings with bond market liquidity and sort-term risks of deflation. The market is concerned about global growth but the BOE has remained hawkish and optimistic.
Another optimistic sign came from US consumers as Sept consumer confidence rose to 103.0 from 101.5 and beat the 96.8 consensus. That was balanced by US goods trade balance numbers that showed a hefty August deficit in another sign that the strong US dollar is hurting exports. The report led economists to downgrade Q3 GDP estimates. Many are now below 2% and that strengthens our conviction that the Fed won't hike this year.
Up next, the focus is on Japan with industrial production and retail sales numbers for August due at 2350 GMT. Abe was out in the media talking about Abenomics 2.0 and pumping up the economy. The BOJ eased last October, could his comment be a sign of another Halloween trick? For the data, production is expected up 1.0% m/m and retail sales forecast at +0.5% m/m. It would take a hefty miss to ramp up BOJ talk and boost yen crosses.
| Act | Exp | Prev | GMT |
|---|---|---|---|
| Retail Trade s.a (AUG) (m/m) | |||
| 1.2% | Sep 29 23:50 | ||
| Retail Trade (AUG) (y/y) | |||
| 1.1% | 1.6% | Sep 29 23:50 | |
| Germany Retail Sales (AUG) (m/m) | |||
| 0.2% | 1.4% | Sep 30 6:00 | |
| Germany Retail Sales (AUG) (y/y) | |||
| 3.1% | 3.3% | Sep 30 6:00 | |
| Industrial Production (AUG) (m/m) [P] | |||
| 1.0% | -0.8% | Sep 29 23:50 | |
| Industrial Production (AUG) (y/y) [P] | |||
| 0% | Sep 29 23:50 | ||
| Eurozone Spanish Flash CPI (y/y) | |||
| -0.9% | -0.6% | -0.4% | Sep 29 7:00 |
| Eurozone CPI (SEP) (y/y) [P] | |||
| 0.0% | 0.1% | Sep 30 9:00 | |
| Eurozone CPI - Core (SEP) (y/y) [P] | |||
| 0.9% | 0.9% | Sep 30 9:00 | |
| Germany CPI (SEP) (m/m) [P] | |||
| -0.2% | -0.1% | 0.0% | Sep 29 12:00 |
| Germany CPI (SEP) (y/y) [P] | |||
| 0.0% | 0.1% | 0.2% | Sep 29 12:00 |
| Germany CPI - EU Harmonised (SEP) (y/y) [P] | |||
| -0.2% | 0.0% | 0.1% | Sep 29 12:00 |
| Germany CPI - EU Harmonised (SEP) (m/m) [P] | |||
| -0.3% | -0.1% | 0.0% | Sep 29 12:00 |
| Goods Trade Balance (AUG) | |||
| $-67.19B | $-57.30B | $-59.10B | Sep 29 12:30 |
| GDP (JUL) (m/m) | |||
| 0.2% | 0.5% | Sep 30 12:30 | |
| Eurozone Consumer Confidence (SEP) | |||
| -7.1 | -7.1 | -7.1 | Sep 29 9:00 |
| CB Consumer Confidence (SEP) | |||
| 103.0 | 96.1 | 101.3 | Sep 29 14:00 |
Volkswagen & DAX: Allocation & Dislocation
As the Volkswagen fallout intensifies and shares plummet 41% so far this year, the high concentration of auto-industry stocks Germany's DAX is worth watching. Germany's automaking sector makes up 16% of the 30-stock DAX index, compared to only 5% for the Eurostoxx. In the US, autos and autoparts shares make up 1.1% of the S&P500, 0.3% in the FTSE-100, 9% in the Nikkei-225, 12% in the Topix and 3% in the Shanghai Composite.
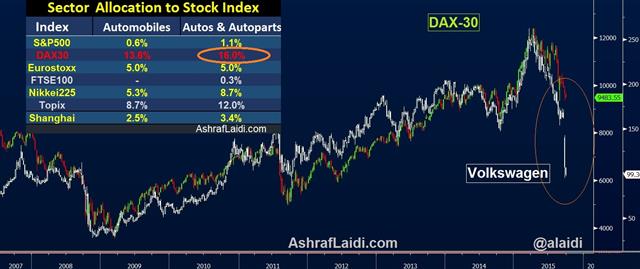
The surging positive correlation between VW and the Dax stood as high 79% as early as two months ago before tumbling in the midst of VW price collapse. The high concentration of auto-related stocks in the Dax implies that suppliers, auto-parts makers and even competitors (BMW and Daimler) will continue to drag on the index.
It is not far-fetched for mean-reversion to ensue in the VW-DAX correlation. The transmission mechanism for DAX to catch-down with VW is explained in more detail below and the quarterly cycle patterns are covered in our DAX Premium trades.
Qatar Holdings is revealed to have lost about $4.8 bn from its VW common shares as a result of its 17% share of VW common stock and 13% of its preferred stock. When will sovereign wealth funds losses prompt broad selling in VW shares remains to be seen.
The cascading of VW ratings downgrades from a wide array of banks and brokerages (SocGen, Deutsche Bank, Natixis, JP Morgan, DZ Bank, Equinet, Magna, Safra and Kepler Chevreux) to a sell or a hold is far from complete. So far, nine brokerages/banks have downgraded the stock, most likely prompting further allocation shift and downgrades from asset and fund managers.
Bond Spreads' Golden Cross & the Fed Obstacle
Not all obstacles to a Fed hike are located outside of the US. The escalation in high yield corporate bond spreads to three-year highs resulting from plunging energy prices has worsened the debt profile of several oil & gas companies, to the extent that oil prices have become more instrumental fueling bond spreads than interest rates. With treasury yields on the rise and high yield spreads following closely behind, even a modest Fed hike would have a not-so modest impact on the sustainability of debt financing in oil and gas as well as the suppliers dependent upon on them (like Caterpillar).

15 of the 17 US firms listed in Bloomberg's debt profiling for exploration & production with market capitalisation above $5bn have seen their credit profile deteriorate and risk of default rise over the past 2 years. In the case of oil & gas Services equipment, six of the 7 companies have sustained deterioration. These companies are Antero, Apache, ConocoPhillips, EQT, Halliburton, Helmerich and Marathon Oil.
Six US energy companies have already filed for bankruptcy this year. According to Fitch Ratings, the default rate among US energy firms short up to 4.8%, the highest since 1999. Defaults in exploration and production sector companies hit a rate of 8.5% also at five-year high. Sub-investment grade US energy bonds show a yield of 11%, a little off its July 2009 high and almost double its 5.9% rate a year ago.
Corporate bond spreads measure the difference between high-yield corporate bonds (also known as junk bonds) and U.S. government bonds of similar maturities. The higher the risk faced by a bond issuer, the higher interest rate demanded by holders of the bond. With US govt debt considered to be the least risky from the perspective of credit risk (chances of default), yields on treasuries are relatively lower than those on corporate bonds, especially as companies face credit, business and inflation risk.
VIX & High-Yield Spreads Hand-in-Hand
The 2nd chart highlights the positive correlation between corporate bond spreads and the VIX index. The relation is so close to the extent, that both of the VIX and the high-yield spread index have formed a rare Golden Cross pattern, whereby their 55-week moving average exceeds the 100-week moving average for the first time since August 2007.Rising VIX coincides with the ascent in bond spreads as equity investors and speculators grow risk averse and the economy slows, while credit and business risk weigh on the solvency of highly leveraged companies.
Just as a rising VIX tends to reflect increased volatility (fear) in the general market, increasing bond spreads are indicative of emerging worries with corporate finances, which is more likely to be the case during market uncertainty and/or economic slowdown. Falling or low bond spreads usually prevail during periods of healthier economic growth, falling risk, and increased bond market liquidity. Similar to a low VIX, excessively low bond spreads can be a sign of investor complacency and a disregard of the risks associated with high-yield bonds.
The rate of deterioration in the debt profile of energy and mining companies is far from that reached by sub-prime lenders in 2007-2009. But the situation is getting worse. A Fed hike would be a costly and embarrassing policy mistake.
The VIX-Bond Spread relationship was discussed in detail in chapter five of my book.
| Act | Exp | Prev | GMT |
|---|---|---|---|
| Fed's William Dudley speech | |||
| Sep 28 12:30 | |||
| Fed's Evans Speech | |||
| Sep 28 17:30 | |||
| FOMC's Williams speech | |||
| Sep 28 21:00 | |||
Euro Shrugs Off Spain, NBI Chart Revisit
Independence talk is ramping up in the Spanish region of Catalonia after separatist parties won control of the legislature in a Sunday vote but the market isn't worried. The kiwi is the early laggard on soft employment confidence numbers while cable leads after six days of declines. Weekly CFTC positioning data showed traders reluctant to bet against the pound. A new Premium trade/chart/note was issued on Friday ahead of Friday's NFP & the likelihood of any BoJ action.
Voting results from the Catalonia election showed the main separatist party and far-left pro-separatists winning a small majority in the regional legislature. After the national government halted a separation referendum last year, this was seen as a proxy.
It's a powerful region but the risks of a breakup are low. Like we saw in Scotland, symbolic votes and polls are one thing but when it's time to cast the true ballot, voters get cold feet. If the euro falls hard in early European trading, don't expect it to last.
The bigger picture may be more important. What we continue to see as the driving force in developed-world politics is frustration with austerity. Larger deficits will prove to be simulative for medium-term economic growth until the debt market enforces another round of discipline when another crisis hits.
In the short term, the New Zealand dollar is down 20 pips to start the week after Wetpac's quarterly employee confidence survey fell to a 3-year low of 99.3 from 102.8.
Trading may be quiet in Asia with China on holiday. The economic calendar is light with only the low-tier China industrial profits at 0130 GMT and Japanese leading index at 0500 GMT. The event to watch out for is a speech from Kuroda later but there isn't yet a set time.
Commitments of Traders
Speculative net futures trader positions as of the close on Tuesday. Net short denoted by - long by +.
EUR -81K vs -82K prior JPY -24K vs -27K prior GBP +1K vs -4K prior AUD -53K vs -41K prior CAD -38K vs -47K prior CHF -2K vs +4K prior
On the net, US dollar longs fell to the lowest in more than a year. In general, the moves were small but the market missed the CAD and GBP moves last week. The pound, in particular, is confounding traders.
| Act | Exp | Prev | GMT |
|---|---|---|---|
| Leading Economic Index (JUL) | |||
| 104.9 | Sep 28 5:00 | ||
| Fed's Evans Speech | |||
| Sep 28 17:30 | |||
| FOMC's Williams speech | |||
| Sep 28 21:00 | |||


