Euro Net Spec Shorts Seen Followed by EURUSD Spot
by Ashraf Laidi
Dec 9, 2011 21:04 | 10 Comments

Click To Enlarge
Euro Net Spec Shorts Seen Followed by EURUSD Spot - EURUSD Spec Dec 9 (Chart 1)

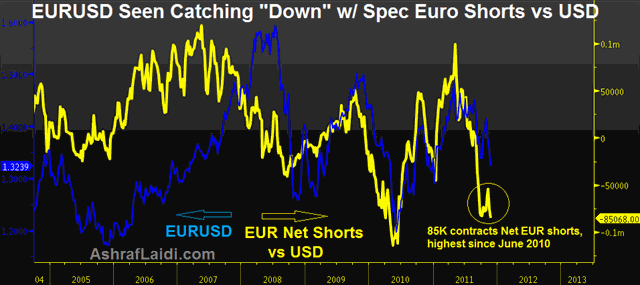
Net speculative shorts in EUR vs USD have reached 85K contracts, their highest since mid June 2010 .... which is the worst of last years PIIGS crisis, coinciding with the bottom in EURUSD at 1.1870. With the Eurozone landscape deteriorating following 4 bailouts (2 for Greece, 1 for Portugal, 1 for Ireland) and the AAA rating of France and Germany on the verge of being re-considered (or downgraded), the arguments for further downside in EURUSD is bolstered further. For the Technically-versed readers, EURUSD remains a head-&-shoulder formation, with 1.29 seen re-emerging before mid Q1 2012. As hedge funds further unload EUR longs, while others re-enter fresh shorts, the EURUSD spot rate is expected to catch-up with surging net short-interest in EURUSD. None of these conditions are expected to stabilize the soaring swap costs of USD at Eurozone banks.


More Hot-Charts

  • Bitcoin versus Miners Performance  Chart

    Bitcoin versus Miners Performance

    Apr 9, 2024 16:02 | by Ashraf Laidi
    As many of you know 2023 was kind to members of our WhatsApp Broadcast Group who snapped up shares in bitcoin miners, while 2024 has so far been more superior to Bitcoin than most of the miners...
  • Gold, Bitcoin, USD Combo Chart

    Gold, Bitcoin, USD Combo

    Jun 22, 2023 16:46 | by Ashraf Laidi
    I mentioned last week  on here on how and why both gold and USD are falling together. Since then, the trend accelerated alongside another detail.
  • تفسير مراحل الذهب  Chart

    تفسير مراحل الذهب

    Mar 17, 2023 21:28 | by Ashraf Laidi
    .
Hot-Chart Archives
Comments (Showing latest 10 of 10) View All Comments
DaveO
N.Cornwall, UK
Posts: 5733
12 years ago
Dec 19, 2011 10:32
However I admit I am taking Ahsraf's observation out of context
DaveO
N.Cornwall, UK
Posts: 5733
12 years ago
Dec 19, 2011 10:30
I can never get too excited about cot data which is lagging real time - 3 to 5 days. Seems wierd in this day of HFT and nano technology.
jacek
Melbourne, Australia
Posts: 2579
12 years ago
Dec 19, 2011 0:53
yeap.. a short covering probably due.. but from what level?.. perhaps 1.27-28?
Ashraf Laidi
London, UK
Posts: 0
12 years ago
Dec 18, 2011 23:35
When I posted this chart I warned abt escalating net shorts in $EURUSD.

we're new below it that Yellow line at -116K and EURUSD has dropped well below that yellow line.


Ashraf
DaveO
N.Cornwall, UK
Posts: 5733
12 years ago
Dec 12, 2011 20:23
No Ashraf, never been my claim to be ahead of you :-) Just slow down on perfecting your chart presentations. Dark blue on black is a little dumb or did you want to hide the very imperfect H&S :-)

(Like fxpanther, I avoid calling H&S unless near perfect, just my opinion).
Ashraf Laidi
London, UK
Posts: 0
12 years ago
Dec 12, 2011 17:07
Dave,

You're asking ME to "slowdown". I thought you were ahead of all of us.

Vaquero, Alex, fxpanther,

If you want to find the perfect H&S with perfectly horizontal neckline & shoulders, youll be waiting a while.

1.4270-80 is R & L shoulders. Imperfect head. Yes, it's far from perfect


Ashraf

fxpanther
California , United States
Posted Anonymously
12 years ago
Dec 12, 2011 11:15
If you cant see a HS, is beacuse there isnt! Do turst in yourself recognizing a pattern. Moreover, HS usully forms after a run-up, where is that run-up? The descend is in progress long time. Now, the only way to go EURUSD is to FADE the down move, or wait for correction to 1,38....

And remember, my analyses or anybody's else is just as good as yours.

be disciplined,
fxpanther
Alex Salmond MSP
Port Louis, Mauritius
Posts: 8
12 years ago
Dec 11, 2011 22:23
the h&s is there but admittedly not particularly easy to spot on ashraf's chart; the left shoulder started in sept 2010, the head in jan 2011, the right should started in october this year
Vaquero
New Mexico, United States
Posts: 1
12 years ago
Dec 10, 2011 15:34
Hi Ashraf:
I am new to your site = its great, I cannot make out the H & S on this chart either,--- what would be the neckline figure (price) ?
Thanks
DaveO
N.Cornwall, UK
Posts: 5733
12 years ago
Dec 10, 2011 10:57
Dark blue on black really does not work at all well. I'm sure you could find a more suitable contrast in your charting package Ashraf if you just slow down a titch. The referred H&S is indiscernible on this chart.