EURUSD Shorts vs USDX Longs

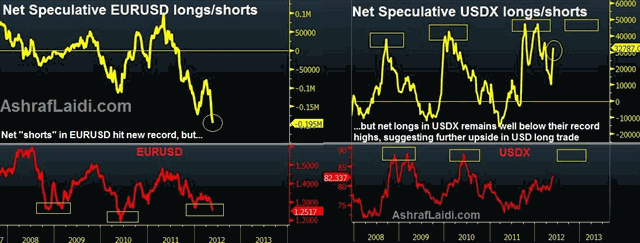
The new record high in net EURUSD shorts of 195,000 contracts (shown as new low in net positioning in chart) coincides with 2-year lows in the single currency. Traders sometimes view such extreme data as a contrarian signal, suggesting a turnaround, or at least a stabilization in the prevailing trend.
Nonetheless, when we look at net longs in the US dollar index, we see there are is no such extreme positioning, where the number of net longs reached 32,787 contracts, well below the record 46,923 contracts reached in January.
IN ORDER TO AVOID CONFUSION, we clarify that we are examining the NET POSITIONING (difference between long and short) and NOT the absolute or gross longs or shorts. Thus, even though USDX longs have reached all time highs, the net longs (longs minus shorts) are at 32787, below the 46,923 record.
Recall the US dollar index, is basket against 6 currencies (EUR, JPY, GBP, CAD, CHF and SEK), 57% of which is dominated by the EUR. It can be argued the reason that open long interest in USDX is relatively calm is due to the deterioration in USD against JPY. Yet, USDX is already hitting 2-year highs at 82.46.
Profit-maximizing futures traders (traders and CTAs) seeking opportunities with sufficient upside potential may view the relatively low long interest in USDX as a partial argument for adding to existing longs, which could potentially extend USD to the 86-87 level.
Last week's release of the US consumer sentiment survey hitting the highest level since October 2007 may not agree with last weeks release of the Philly Fed survey dipping to its worst since summer, but does signify some strong sectors in the US. A flight-to-safety reaction into the US dollar from a Spanish state debt moratorium (as was in Brazil in 1998) or more inconclusive Greek elections could well lift up USD as was the case in 2008 crisis or the 2010 wave of Eurozone downgrades (see red USD chart). This could start turning macro-trading into a USD-centered environment and accumulate aggressive build-up in USDX positioning.
For a similar analysis on GOLD & US CRUDE COT speculative charts and relevant trading ideas, please see todays edition of the Intermarket Insights by clicking here: http://ashraflaidi.com/products/sub01/access/?a=641 Non subscribers, can click here to join http://ashraflaidi.com/products/sub01
More Hot-Charts
-

EURGBP Channel Test
Jan 22, 2026 13:20 | by Ashraf LaidiEURGBP is on the cusp of a channel breakout. One of the least well known secrets is how this pair correlates with major equity indices. -

Gold Channel ABC and D
Jan 8, 2026 16:27 | by Ashraf Laidiسأرسل رسالة صوتية و كتابية توضيحية لأعضاء مجموعة الواتساب الخاصة حول هذه المخططات - Will send detailed note on latest parameters to our WhatsApp Bdcst Group - -... -

EURUSD Next
Jan 5, 2026 17:09 | by Ashraf LaidiIf EURUSD holds Monday above 1.17, it will show a hammer candle, supported above the 100-day moving average.


