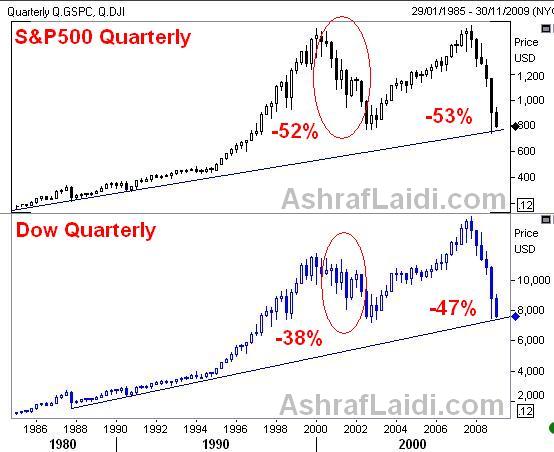
Multi Year Equity Cycles

With both the Dow and S&P500 nearing their Nov lows, a breach of those levels is increasingly imminent. My forecasts suggest at least another 30-35% slide in the major indices into the next 6-8 months to be made possible by the next round of hedge fund (and mutual fund) redemptions. Recall that that 52% and 38% peak-to-trough declines in the S&P and Dow in the 2000-2 bear market emerged mainly due to overvalued stocks (and not on a banking or housing crisis). the likelihood for additional declines from the current 53% and 47% peak-to-trough declines is significant. integrating these analysis with my latest on Equity/Gold ratio, 5,300 Dow and 520 S&P500 looms large.
More Hot-Charts
-

Mystery Charts
Feb 5, 2026 20:48 | by Ashraf Laidiسأرسل رسالة صوتية و كتابية توضيحية لأعضاء مجموعة الواتساب الخاصة حول هذه المخططات Will send detailed note on latest parameters to our WhatsApp Bdcst Group... -

2hr Gold Chart
Feb 3, 2026 13:09 | by Ashraf Laidiسأرسل رسالة صوتية و كتابية توضيحية لأعضاء مجموعة الواتساب الخاصة حول هذه المخططات Will send detailed note on latest parameters to our WhatsApp Bdcst Group... -

Gold Net Longs
Feb 2, 2026 17:16 | by Ashraf LaidiI really dislike after-the-fact analysis, but looking at this chart of Gold speculative net longs at the Comex, it shows speculators began lightening their longs on Jan 23.


