Hot-Charts
Analog of USDJPY Net Longs Breakdown
by
Feb 27, 2021 1:00
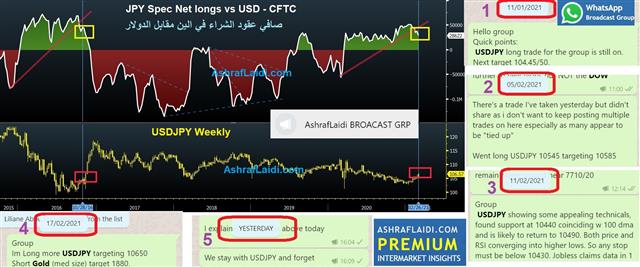
The prolonged ascent in USDJPY remains fortified by the technical breakdown in net JPY futures longs (inversely related with USDJPY pair) shown in this striking analog from Q4 2016. See also how we consistently informed our WhatsApp Broadcast Group we went long on Jan 11th (upper right figure) at 104.20s, followed by February 5th, February 11th, until yesterday (Feb 27th). 107.30 is the next logical destination. للتفسير بالعربي الرجاء استماع الرسالة الصوتية في قناتي تلغرام
Click To Enlarge
Click To Enlarge

More Hot-Charts
-
Gold retracements
Nov 12, 2025 17:10 | by Ashraf Laidiسأرسل رسالة صوتية و كتابية توضيحية لأعضاء مجموعة الواتساب الخاصة حول هذه المخططات - Will send detailed note on latest technical parameters to our WhatsApp Bdcst Group - .. -
Selected Stocks
Nov 3, 2025 16:06 | by Ashraf Laidiسأرسل رسالة صوتية و كتابية توضيحية لأعضاء مجموعة الواتساب الخاصة حول هذه المخططات - Will send a detailed note on latest technical parameters to our WhatsApp Bdcst Group... -
Gold Range or Shoulders?
Oct 31, 2025 11:59 | by Ashraf Laidiسأرسل رسالة صوتية و كتابية توضيحية لأعضاء مجموعة الواتساب الخاصة حول هذه المخططات - Will send a detailed note on latest technical parameters to our WhatsApp Bdcst Group...
Comments
(Showing latest 0 of 0)
View All Comments
Report Reply


