Hot-Charts
Familiar Fail in Dow SPX Ratio
by
Nov 18, 2016 16:36
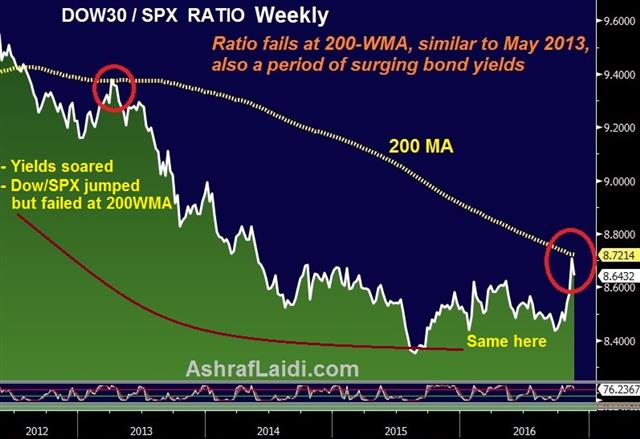
If you think the post-Trump jump in the DOW30 is highly exaggerated, especially relative to the SP500, then take a look at this chart. Interestingly, the DOW/SPX Ratio failed to break above its 200-WMA. The last time such prominent failure occurred was in May 2013, also a time of surging yields, more commonly known as the Taper Tantrum. This backs a new trade in our Premium Insights.
Click To Enlarge
Click To Enlarge

More Hot-Charts
-

Mystery Charts
Feb 5, 2026 20:48 | by Ashraf Laidiسأرسل رسالة صوتية و كتابية توضيحية لأعضاء مجموعة الواتساب الخاصة حول هذه المخططات Will send detailed note on latest parameters to our WhatsApp Bdcst Group... -

2hr Gold Chart
Feb 3, 2026 13:09 | by Ashraf Laidiسأرسل رسالة صوتية و كتابية توضيحية لأعضاء مجموعة الواتساب الخاصة حول هذه المخططات Will send detailed note on latest parameters to our WhatsApp Bdcst Group... -

Gold Net Longs
Feb 2, 2026 17:16 | by Ashraf LaidiI really dislike after-the-fact analysis, but looking at this chart of Gold speculative net longs at the Comex, it shows speculators began lightening their longs on Jan 23.


