Beware of Next Week's Correction
Earlier this year, plenty of ink was spilled about the “January effect” –the positive correlation between stocks' January performance and their year's overall performance. When the S&P500 and Dow Jones Industrials Average fell 3.6% and 5.3% in January respectively, many rushed to warn that equity indices would finish the year lower as they have often done during negative January performances. But as indices hit fresh record highs later in the year, these warnings became a distant memory.
Will next Thursday's historic Scottish independence referendum trigger a dangerous whipsaw in volatility? We already the dangerous implications for a “yes” vote here.
How about the Federal Reserve's Wednesday decision? If the latest Fed forecasts signal earlier than expected tightening, it could prove an excuse for stocks to build on this week's sell-off after five weekly consecutive weekly gains--the longest since November 2013?
Will the VIX on the S&P500 revisit 19.00s from its current 13.00s?
Will bond traders cause further lift-off in yields, following the biggest 2-week percentage gain in US 10-yr yields since summer 2013, when taper panic was all the rage?
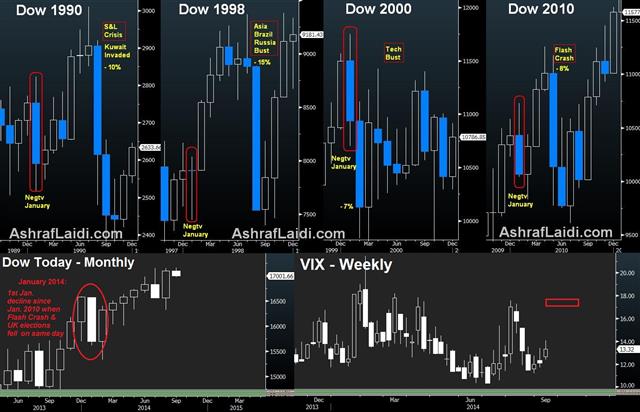
The charts below indicate single-month crashes during years of negative January performance in the S&P500 & DJIA.
January declines & high-profile corrections
2010 – The last time stocks fell in January (-3.5% due to Volcker PropTrading speech) —Eurozone crisis kicked off and the May Flash Crash hit partly due to (GS DoJ investigation).
2008 & 2009 - Negative January for the Dow in January (-4.6% and -8.8% respectively), coinciding with the subprime crisis & global equity crash.
2000 – The bust of the technology bubble was kicked off by a 7% decline in January.
1998 – Another year of spectacular losses when the Asian currency crises coincided with damage in Russia and Brazil, a classic case of emerging markets collapse.
1990 – The year of the US Savings & Loans crisis and Saddam Hussein's invasion of Kuwait started off with a 6% January fall before leading to a 17% decline in Aug-Nov.
- Unlike the popular “January Effect” analysis, which postulates that a decline in January implies a negative year, this analysis does not necessarily infer a decline in the full year, but instead implies 1 or 2 months of sharp declines. Will next week's twin events from the Fed and Scottish referendum deliver the much-awaited decline of at least 10% from peak to trough in US equity indices?
Inevitable surge in volatility
Even if Scotland ends up rejecting independence from the UK, we do not rule out a massive surge in UK and global volatility during the plethora of exit polls, projections and corrections taking place on Thursday night into Friday late morning. Stocks may decline as much 3% to 5% in a single day, bond yields could lose 6 to 10 basis points & yen surges alongside the USD by 2 to 4% versus high risk FX. This would be especially the case as the broadest margin between the “Yes” and “No” camp is currently as little as 3 points. And no matter how Fed chair Yellen attempts in dampening market fears at her Wednesday conference, markets will be unable to ignore any notable shift in the “dots” projections, suggesting an earlier timing of Fed fund hikes.
You have been warned.


