US Jobs Catch up with Reality
Not much has changed in USD trading since our March post. Today's neutral-to-negative US jobs report will not do the job to sway the Fed into raising rates in June. April payrolls rose by 160K (vs exp 200K), the lowest in 7 months after a 208K gain in March. The revisions of the prior 2 months were -19K. The unemployment held at 5%, while the participation rate fell to 62.8% from 63.0%, its first decline in 9 months. The number of people going from being outside the labour force to being employed fell by the greatest amount since April 2014.
The positives in the report were the 2.5% y/y rise in average hourly earnings y after 2.3% in March and the increase in average weekly hours to 34.5 from 34.4. Other decent signs were the 171K increase in private payrolls vs the 11K decline in government jobs.
Despite the recent improvement in hourly earnings, the 2.5% y/y rate remains well below the 3.5% levels seen in the pre-crisis highs. That is unlike, the unemployment rate, which is near the pre-crisis lows.

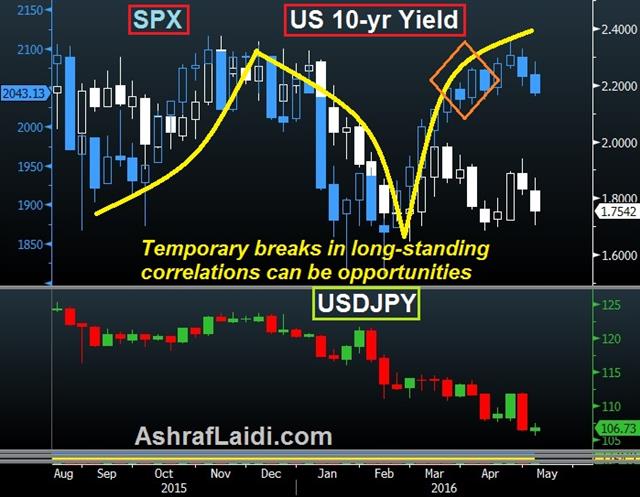
The chart above shows how easily-beaten corporate earnings were able to lift the S&P500 in March-April, making a break away from the positive correlation with US 10-year yields and USDJPY. But the last 2 weeks have seen a normalisation as equities fell back in line.
Jobs are the last to know
One point worth noting, often repeated in my tweets is that labour markets may be a lagging indicator and not a leading sign of economic growth. As firms retrench, they usually start with capex reduction (trilling R&D, technology, opening new markets etc), holding more cash, adding to retained earnings-- only then they pullback from hiring before eventually laying off workers. Thus, the divergence between weak economic activity and robust employment may soon come to an end.
Fed's Inflation-Employment Considerations
The big debate inside the Fed remains whether the US economy has reached or is nearing full employment, also known as non-acceleration inflation rate of unemployment (NAIRU), the rate at which inflation risks pushing higher, or in today's environment, the rate below, which it is difficult to further cut unemployment without stoking inflation.
The problem is that with core PCE price index (Fed's preferred inflation gauge) dropping back to 1.6% y/y in March from 1.7%, inflation may return near the Fed's 2.0% target. Other measures of inflation (driven by bond market expectations) have stalled at 1.64% late last month, the highest seen since July 2015. Fed members in Yellen's camp have long expressed the importance of not rushing with additional rate hikes before seeing: i) more adequate and (durable) signs of improved inflation and ii) prolonged tightness in labour markets. At this point, both factors require further improvement, while foreign risks need to be kept at bay in order for the Fed to move.
The aforementioned inflation/jobs dynamics are most crucial for reading the Fed's intentions. But let's not also forget the broadening weakness in US macro indicators and the most recent growth figures showing Q1 GDP at 0.5%, the lowest in 2 years.
The probability of Fed June hike has now fallen to 2% from 10% prior the reports' release. Stocks have peaked nearly 3 weeks ago after a 16% rally driven mostly by stock-buybacks, easily-beaten expectations in a lowering-of-standards earnings season and stabilizing global economic conditions (lower USD, lower yields, falling volatility).
For the trading-oriented market participants, we issued a trade in equity indices, backed by 4 charts, 5 reasons and 1200 points, while our FX trading subscribers received a new trade in AUD following the downward revision in the Reserve Bank of Australia's inflation outlook.
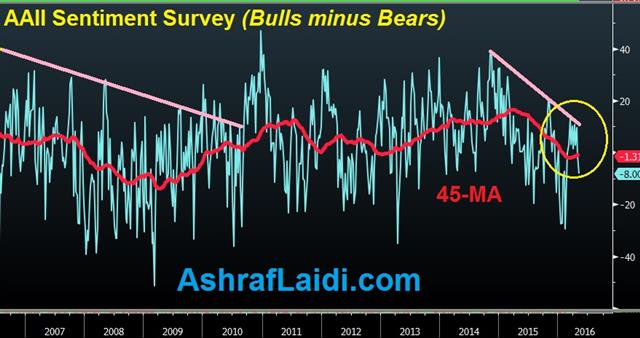
Finally, the bottom chart from the American Association of Individual Investors Sentiment Survey measures members who are bullish, bearish, and neutral for the next six months. The bullish-bearish spread never broke above its key resistance lebvel, which may seem a travesty for individuals with an aversion to technical analysis.


