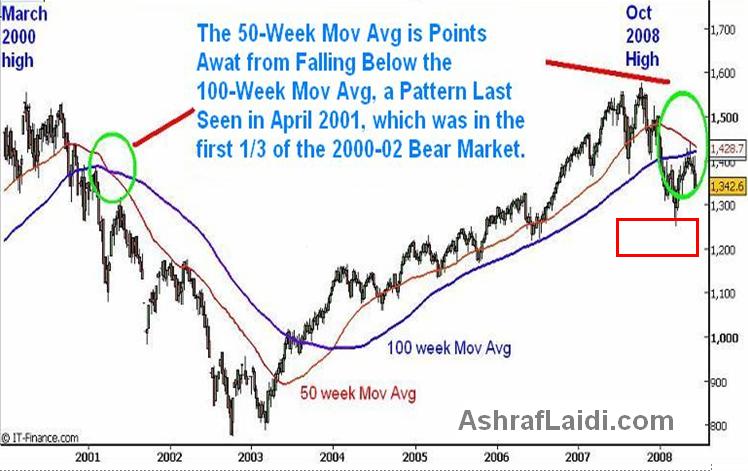
Warning Signal from S&P's 50 and 100 Week MA
The 10 am release of the Philadelphia Fed index will be crucial in gauging the weakness in a key manufacturing region for the month of June. The headline index is expected to have edged up to -10 from -15.6, showing a negative reading for the 7 th straight month, the longest sub-zero streak since the 13 consecutive months between December 2000 and 20001. Markets will scrutinize the new orders and employment indices, both of which improved in May but remained below zero at -3.7 and -1.0 respectively.
Also at 10 am EST is the leading indicators index expected flat in May, following a 0.1% rise in April and March.
The dollar is off its lows of the European and Asian sessions but remains generally under pressure for the week in light of renewed downside risks to the US economy, via i) macroeconomic data; ii) gloomy earnings reports by bellwether companies such as Fedex; and iii) continued losses on the banking sector. The breadth of negative economic and market currents highlights the necessity for the Federal Reserve to maintain interest rates on hold, and the possible risk for renewed rate cuts later this year.
Recall, that while the Fed has toughened its inflation rhetoric, it has by no means upgraded its growth assessment. Indeed, the latest macroeconomic data and earnings reports have reminded bond and equity participants why the Feds stance on economic growth remains unchanged. Noting the Feds efforts to steer interest rate expectations into the direction of inflationary expectations, i.e, keeping rates unchanged into end of year and possibly a rate hike in early Q1, we remain skeptical whether equity markets will allow further increase in bond yields without a protracted sell-off given the aforementioned negative currents. 
Technically speaking, the S&P500 is nearing a trend pattern not seen since April 2001, which was the first third of the 2000-2 recession/bear market. The chart illustrates that the 50-week moving average is a few points away from falling below the 100-week moving average, a pattern not seen since April 2001. The technical significance is underlined by the fact price repercussions of short-term moving averages falling below longer term averages, implying that the appreciable rate of deterioration in current price trends. The importance of the relationship is also substantiated by the fact that 100-50 week average crossover of April 2001 occurred when the S&P500 dropped 13% off its March 2000 high, while the current price point coincides with a 17% decline off the October record high.


