Intraday Market Thoughts Archives
Displaying results for week of Jan 23, 2022Latest Weekly Count تحديث العد الاسبوعي
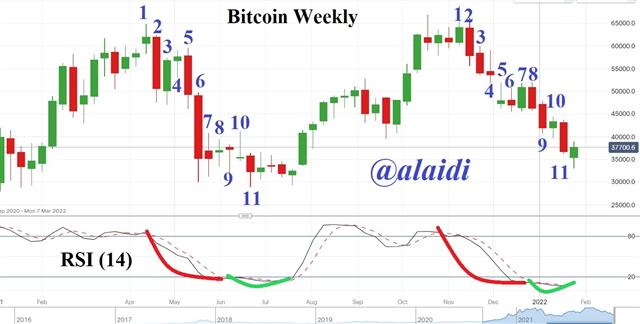
Just when you thought it no longer worked, the Bitcoin weekly count reaffirms its validity. إلا عندما تنسى العد الأسبوعي يذكرك بصلاحيته

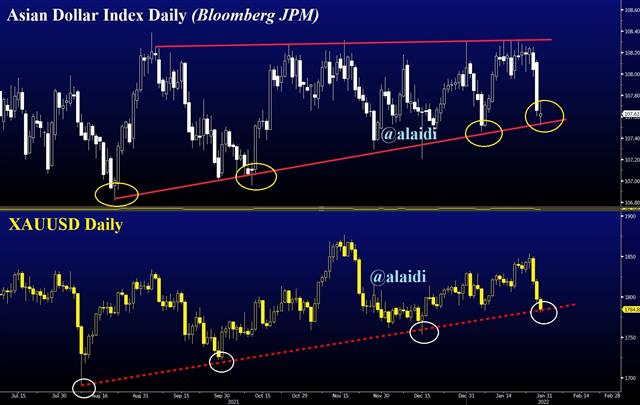
The Other Dollar Index

I bring this up now due to the Asian index's (ADXY) ability to serve as a proxy to a crucial trading bloc with more weighting in the Chinese yuan. The ADXY even helped me shed light on how/why the US dollar was gaining in the past simultaneously alongside gold in 25:10 mins of this video.
We could well see gold extend to $1770 or $1760 next week, and ADXY extending weakness to 107.00, but traders ought to remember the difference between closing and intraday lows. Add to this that demand/supply inflationary forces may will likely overwhelm timid rate hikes from the Fed (especially when Fed plans to let assets rolloff rather than sell them), and gold will have more breathing room than in the tightening cycles of 2015 or 2018. Stay tuned.
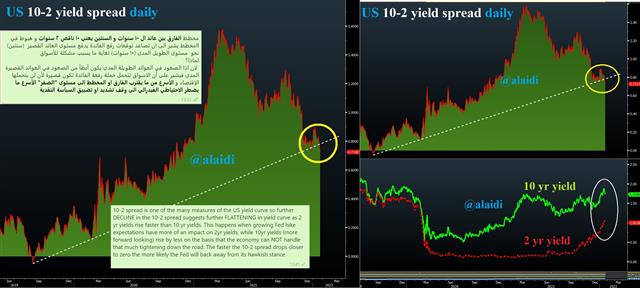
10 2 breaking support? منحنى العوائد
Friday's post showing a possible top in US 10 year yields goes in line with the 10-2 charts. The left-hand chart shows the deterioration in the 10-2 spread, reflecting further flattening in the yield curve. This is usually a sign of the bond market challenging the Fed's rate hike expectations. Retail traders are often advised to NOT to fight the Fed, but this does NOT APPLY for the bond market, which often fights/challenges the Fed and wins. See full explanation inside the charts.


