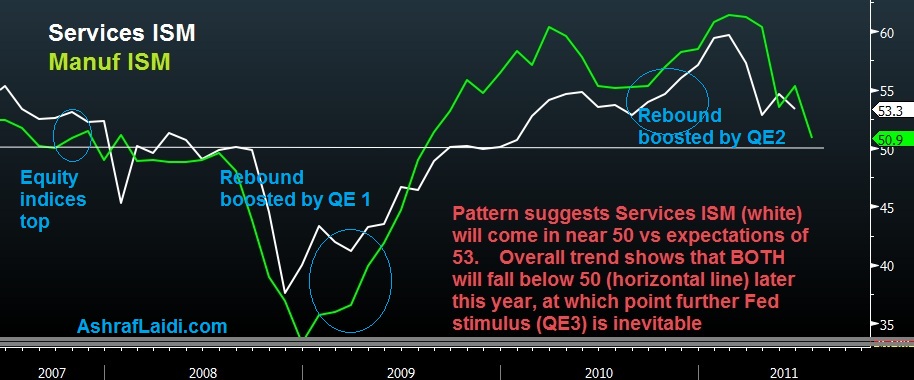
US ISM: Manufacturing vs Services

Looking at the way the manufacturing ISM (green) has preceded services ISM (white) into the downside, it is fair to expect today's release of July services ISM to come in near 50 than the expected 53. More importantly (and worryingly), the overall downtrend appears unlikely to be reversed without any considerable dosage of stimulus. Watch in Q4 2010 how both ISMs recovered on the anticipation/announcement of the Feds QE3 program. Without the stimulus, the ISMs appeared to have been heading back below 50. Similarly, the rebound in Q2 2009 was partly boosted by the official announcement of QE1 in March 2009. But the move was signalled 3 months earlier by the Feds decision to slash interest rates to zero in December 2008. BOTTOM LINE: QE3 is inevitable. It may not be called QE3, but it will take the form of further stimulus, at which point it will test the resilience of the market bears (not bulls). Stay tuned in our Daily Premium "Intermarket Insights" for directional calls here: http://www.ashraflaidi.com/products/sub01/
More Hot-Charts
-

Mystery Charts
Feb 5, 2026 20:48 | by Ashraf Laidiسأرسل رسالة صوتية و كتابية توضيحية لأعضاء مجموعة الواتساب الخاصة حول هذه المخططات Will send detailed note on latest parameters to our WhatsApp Bdcst Group... -

2hr Gold Chart
Feb 3, 2026 13:09 | by Ashraf Laidiسأرسل رسالة صوتية و كتابية توضيحية لأعضاء مجموعة الواتساب الخاصة حول هذه المخططات Will send detailed note on latest parameters to our WhatsApp Bdcst Group... -

Gold Net Longs
Feb 2, 2026 17:16 | by Ashraf LaidiI really dislike after-the-fact analysis, but looking at this chart of Gold speculative net longs at the Comex, it shows speculators began lightening their longs on Jan 23.


