Where to for Gold & Silver?

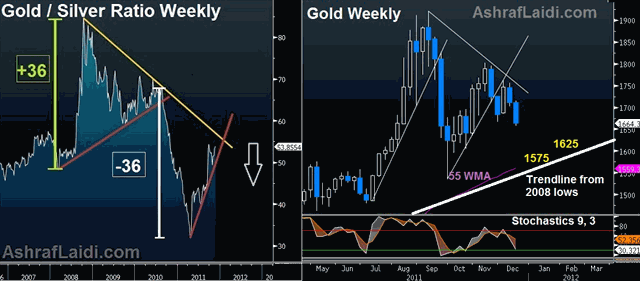
Our Premium subscribers may not be surprised by the $100 decline in gold over the last 8 trading days. But how far will it go from here and what would be the move relative to silver? Gold has more than made up for last years underperformance relative silver, rising 20% year-to-date, compared to silvers +4% on the same period. =========== CLICK ON CHART TO ENLARGE ========= The years hikes in silver margin requirements proved more punishing for silver, whose steep rally from early September 2010 (when US QE3 was all but confirmed) to late April 2011, was a whopping 82%, compared to a mere 54% for gold over the same period. Silvers rapid elevation meant a more violent decline in response to the interventions from Comex. Since then, investors have grown reluctant in taking aggressive positions in the cheaper metal. Another sign in favour of silver is the latest speculative net long positions in silver COMEX vs. those in gold.
REGARDING THE GOLD/SILVER RATIO, note how it is facing a key trendline resistance extending from October 2008just before golds infamous 30% plunge against the US dollar. The symmetry of triangular formations in the G/S ratio suggest that a peak at 55 before a decline to at least the low 30s. The catalyst behind such a decline in the ratio is likely to be continued unwinding of gold longs, which have been accumulated in August/September during the escalating Eurozone debt crisis. As fund managers shift towards CASHING THEIR SAFE-HAVEN holdings by raising cash and selling gold, the yellow metal is likely to remain pressured, especially by any USD rallies occurring during risk aversion. Gold is seen stabilizing near 1560 support. Any clear close below 1570 risks extending losses to 1400 (unlikely). Silver is vulnerable to a renewed decline blow $30, but sub $28 remains implausible due to the lack of accumulated build-up.
To subscribe to our daily Premium Intermarket Insights, please visit http://ashraflaidi.com/products/sub01/ TWITTER: @alaidi
More Hot-Charts
-

Gold Channel ABC and D
Jan 8, 2026 16:27 | by Ashraf Laidiسأرسل رسالة صوتية و كتابية توضيحية لأعضاء مجموعة الواتساب الخاصة حول هذه المخططات - Will send detailed note on latest parameters to our WhatsApp Bdcst Group - -... -

EURUSD Next
Jan 5, 2026 17:09 | by Ashraf LaidiIf EURUSD holds Monday above 1.17, it will show a hammer candle, supported above the 100-day moving average. -
Gold Next Move
Dec 26, 2025 15:32 | by Ashraf LaidiWill send detailed note on latest parameters to our WhatsApp Bdcst Group - سأرسل رسالة صوتية و كتابية توضيحية لأعضاء مجموعة الواتساب الخاصة حول هذه المخططات - ..


