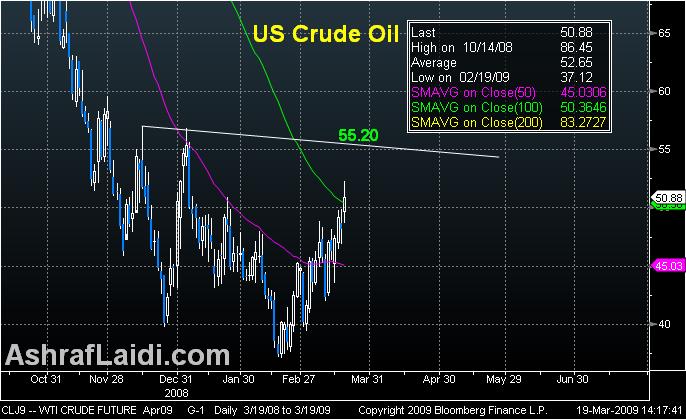
Oil Targeting $55.00

by Ashraf Laidi
Mar 19, 2009 14:37 | 9 Comments

Oil Targeting $55.00 - Oil Mar 19 (Chart 1)

Oils break above its 100-day MA for the first time since August has further upside to garner as the momentum traders will be prompted by ample territory towards the $55.00-20 target. Todays most likely close about $50.30, is already validating the uptrend, while a close above $50.80 for the week should spell more definitive upside as it signals the top of the rising channel from the Feb 19 low. Integrating intermarket analysis into my underlying assessment for prolonged gains in risk appetite, the time element remains supportive, especially as this remains clearly a dollar-driven story.


More Hot-Charts

  • Bitcoin versus Miners Performance  Chart

    Bitcoin versus Miners Performance

    Apr 9, 2024 16:02 | by Ashraf Laidi
    As many of you know 2023 was kind to members of our WhatsApp Broadcast Group who snapped up shares in bitcoin miners, while 2024 has so far been more superior to Bitcoin than most of the miners...
  • Gold, Bitcoin, USD Combo Chart

    Gold, Bitcoin, USD Combo

    Jun 22, 2023 16:46 | by Ashraf Laidi
    I mentioned last week  on here on how and why both gold and USD are falling together. Since then, the trend accelerated alongside another detail.
  • تفسير مراحل الذهب  Chart

    تفسير مراحل الذهب

    Mar 17, 2023 21:28 | by Ashraf Laidi
    .
Hot-Chart Archives
Comments (Showing latest 9 of 9) View All Comments
Ashraf Laidi
London, UK
Posts: 0
15 years ago
Mar 23, 2009 14:12
Hi Eben, gold trades in function of dollar, financial stocks, cenbank quantitative easing hedge funds, ETFS... so it wont be smooth but look at the gold chart of the latest article and youll see it continues to respect the channek support.

Ashraf
Eben
UK
Posted Anonymously
15 years ago
Mar 23, 2009 13:06
Hi Ashraf,

Many thanks for all your deepth insights in the FX market. I met you few times at Bloomberg and CMC and your views are absolutely awesome.

I have been fellowing Gold movements for some time now, but it does not fellow its trends some times but stand still or changes to wrong dircection completely. I know you do got great ideas about Gold movements.

why it keep changing trends..? Hope to see you again.

Eben
Ashraf Laidi
London, UK
Posts: 0
15 years ago
Mar 20, 2009 20:33
Hi Nikhil, nice to see you on the site. And thanks for getting the book. Please feel free to provide your own review on Amazon. Thanks

Ashraf
Nikhil
Washington, United States
Posts: 1
15 years ago
Mar 20, 2009 19:53
Nice analysis from all and thanks you Ashraf for the oppertunity to add to you website i had meet you on the Las Vegas forex show in October 2008 i was impressed with you knowledge of the markets and that time you had shared, that you had a book coming well i got it and i enjoyed it throughtly

Thanks again on the EUR/USD i do see a retracement till next monthe and after that price action will thell if the Monthly chart is done going down and i'm sure it will affect the oil trade so until than i'm still bearish on the monthly chart on the EUR/USD so i look at it as a Fractol run on the weekly not long term as of yet

Thanks

Nikhil
Ashraf Laidi
London, UK
Posts: 0
15 years ago
Mar 20, 2009 16:10
ISI, these are all general questions. Most of theem were answered throught my articles over past 4 months. as for the targets for eurusd pls read the IMTs and Hot-Charts and everything is in there incl the latest article.

best

Ashraf
baleal
Lisbon, Portugal
Posts: 1
15 years ago
Mar 20, 2009 16:09
Ashraf

according what i read from you yu expect sell pressure on usd till end April (more or less) , and than we will see again traders bying usd. That means , that oil after reach $55 could retest is lows one more, before run up again.

Is that correct?

Thanks and ill read yur book, and try to understand this markets.

Nice Website

isi
marbella, Spain
Posts: 4
15 years ago
Mar 19, 2009 22:44
Thanks Ashraf; am looking forward to reading your book. I have been following your analysis for a couple of years and very much admire your insights and form of analysis.
Since the end of the last year i am at a total loss as to where currencies are going in the medium term (i mainly follow the eur/gbp gbp/usd and eur/usd). With the shear size of the amount of dollars that are being printed and the near zero rates of the usd, it is not clear to me why the dollar is still so strong. On the other hand, the euro zone is clearly behind the curve and may struglge to survive over the next 2 years as the pigs drag it down. The logic would seem that the euro streghtens over the next few months and then collapses again. Where do you see the points of inflexion? And the poor gbp; where will it find its place in the new order. It does not seem to know who to follow, the usd or the euro; or will it come out as a leader having suffred the most?
Ashraf Laidi
London, UK
Posts: 0
15 years ago
Mar 19, 2009 22:10
isi, oil and eurusd relationship correlation has been notoriously positive these past few years. Chapter 2 of my book discusses the historical relation with the US dollar. The relationship is self-feeding as it can be explained with either way... weak dollar means more dollars are needed to buy rising oil, and/or falling dollar entices OPEC to cut supply and push up prices. Despite negative growth dynamics for global economy and negative implications for oil, speculators sense a a bottom was reached for them to start buying low, while consumers start locking up these deliveries in the futures markets at such attractive prices. euro techs suggest $1.3855 is next target.

Ashraf
isi
marbella, Spain
Posts: 4
15 years ago
Mar 19, 2009 19:34
Is it oil prices that follow the eur/usd or vice versa; when oil was at its highest point, the dollar at its lowest; now as oil hit its lowest point, so was the lowest price of oil. The 6% drop in dollar has pulled the oil price higher by an equal %. If there is too much oil around and the fundamentals for it are on the down side, which way do we expect the eur/usd to go?