GBPAUD Testing the Bottom
by Ashraf Laidi
Apr 2, 2009 11:41 | 11 Comments

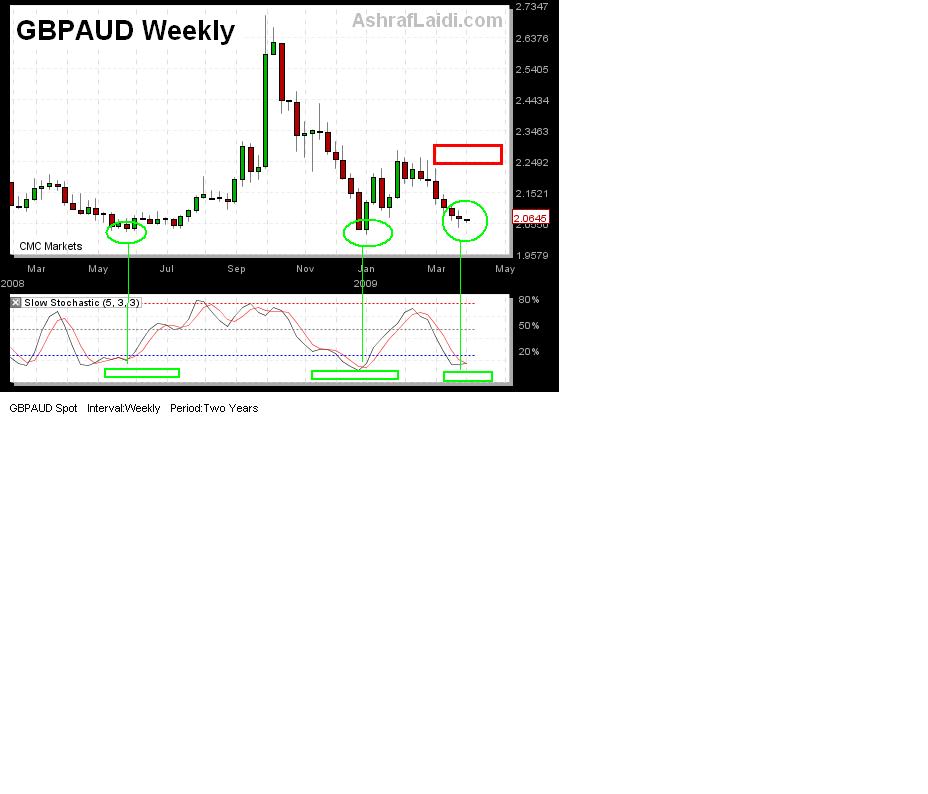
GBPAUD Testing the Bottom - GBPAUD Apr 2 (Chart 1)

Aussie has long been a favourite on this website and its performance speaks for itself. But rather than pitting Aussie against the weak currencies, lets assess its potential against the sterling, whose robust ways suggest more upside for the Aussie against the British currency. The weekly chart shows the oscillators call for a bullish divergence. Sterling has been firming largely due to improved risk appetite but Aussies more fundamental superiority enabled it to quickly recover from negative retail sales. The latest AUDJDPYHotChart took 2 days to be in the money. GBPAUD is more of a longer term play for the 2.097 and 2.11 target to emerge. For more bang out of your buck, consider AUDGBP instead of GBPAUD. This is not only cheaper but offers more pips per capital used.


More Hot-Charts

  • Nasdaq100 Update

    Sep 12, 2024 18:11 | by Ashraf Laidi
    Since entering Nasdaq100 Longs on Monday at 18550, we kept accumulating and locking gains until 19230 yesterday and 19380 today.
  • Pre CPI Charts

    Sep 11, 2024 13:05 | by Ashraf Laidi
    Will Nasdaq extend gains towards 18980s this week before retracing lower on the week of the Fed.
  • Nasdaq100 Daily & Weekly

    Jul 17, 2024 17:53 | by Ashraf Laidi
    The triple top in weekly RSI suggests the following price and time implications:  . PRICE: 18700. TIME: Duration of downside may last for another 3 to 4 weeks.
Hot-Chart Archives
Comments (Showing latest 10 of 11) View All Comments
drexl
copenhagen, Denmark
Posts: 4
15 years ago
Apr 9, 2009 15:11
Ashraf -

Could you please elaborate on your intent with this Hot Chart?

I am also confused about it's message.

Personally, I took the references to the GBPAUD 2.097 and 2.11 targets PLUS the "red square" on the chart highlighting the zone between 2.2492 and 2.5000 as a clear indication of upside potential during the next 2 - 3 months or so. Not to mentioin the Stochastic crossovers in the "oversold" zone . . .

But now that I am seeing your reply to Sam on April 2 (haven't read these posts before now) refering to SHORTING GBPAUD (huh?) I am COMPLETELY confused by this call.

Please elaborate.

Thank You.
Fernando
UK
Posted Anonymously
15 years ago
Apr 8, 2009 17:15
Hi Ashraf,

I do not quite get what you mean by "GBPAUD is more of a longer term play for the 2.097 and 2.11 target to emerge". Do you mean that one shoud use these targets as entry to sell GBPAUD?

Second, to get a real bang for the buck, if I am bullish on AUD (and less bullish on sterling), what do you think of buying AUSSIE200 from my GBP based CFD account?

Look forward to meet you at the 2 day course after next week.

thanks
Ashraf Laidi
London, UK
Posts: 0
15 years ago
Apr 3, 2009 13:07
Glory, I still think the March lows will be retested in in mid to late Q2.
f
Brussels, Belgium
Posts: 25
15 years ago
Apr 3, 2009 9:12
I also have a feeling that the general rally against the USD will probably last until mid month before sharply reversing....
f
Brussels, Belgium
Posts: 25
15 years ago
Apr 3, 2009 8:54
thank you
glory
Singapore, Singapore
Posts: 10
15 years ago
Apr 3, 2009 7:55
Hi Ashraf,

I recently attended your seminar in Spore(Mar'09) and in one of your chart you showed 2 months cycle on the equities i.e Mar 6 was the lowest. Currently the index is moving up and expect the next sell off will be in May based on the two months cycle. With the end of G-20 meeting with a positive note do you think the your view still stands or the bottom is yet to be seen? appreciate your view.

Tks.
Ashraf Laidi
London, UK
Posts: 0
15 years ago
Apr 2, 2009 18:55
ft, i think there's a 75% chance of seeing cable reaching $1.49 before mid month.

Ashraf
f
Brussels, Belgium
Posts: 25
15 years ago
Apr 2, 2009 17:35
Hello Ashraf,

What's your take on GBP.USD - do you think it will manage to break the 1.4770/80 resistance and move to retest 1,49?

Thanks,
PK
New Jersey, United States
Posts: 1
15 years ago
Apr 2, 2009 16:21
Ashraf,
Great site & insight.
I think USD/JPY breaks 100, just takes some work to get through since it is technically a critical level (including breaking through 200 dy MA.

I'm a bit concerned about gold. I'm long and today it is breaking the upward channel trend? What do you make of it. Is this just a reaction to maybe IFM selling of gold to raise cash or ease of general "fear" in the markets. I think long term gold goes higher on inflation but a pull back to 880 means a lot of pain, & could it be a the beginning of trend reversal or sideways movement?

Thanks for your comments!

PK
Ashraf Laidi
London, UK
Posts: 0
15 years ago
Apr 2, 2009 12:24
Sam, AUDUSD still faces upside towards 72 cent but we may not see that until next week. As for shorting GBPAUD, you can go about it by SHORTING GBPUSD and BUYING AUDUSD. A more expensive alternative is SHORTING GBPJPY and BUYING AUDJPY

Ashraf