Hot-Charts
NZDJPY Turnaround?
by
Apr 13, 2009 14:56

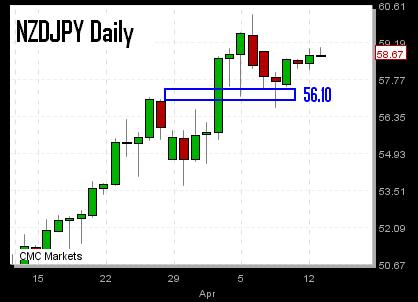
NZDJPY shows signs of ending its 9-week rally as it fails to close above the 59 figure, which is the 38% retracement of the decline from the high of May 2008 to the low of Jan 2009. Risks of a retreat in global indices on a flurry of earnings from US financials could provide the fundamental catalyst to the technical failure. As European bourses return to work on Tuesday, the threat of profit-taking may trigger sell-orders in high yielding FX pairs. Interim target stands at 57.00, followed by 56.10. Resistance stands at the 59.00.
More Hot-Charts
-
Gold Next Move
Dec 26, 2025 15:32 | by Ashraf LaidiWill send detailed note on latest parameters to our WhatsApp Bdcst Group - سأرسل رسالة صوتية و كتابية توضيحية لأعضاء مجموعة الواتساب الخاصة حول هذه المخططات - .. -
EURGBP & Bank of England
Dec 17, 2025 19:24 | by Ashraf LaidiToday's weaker than expected UK CPI sharply boosted EURGBP and dragged down GBPUSD on improved expectations the BoE will cut rates tomorrow (Thursday). -
Indices & Gold Update
Dec 16, 2025 12:16 | by Ashraf Laidiسأرسل رسالة صوتية و كتابية توضيحية لأعضاء مجموعة الواتساب الخاصة حول هذه المخططات - Will send detailed note on latest parameters to our WhatsApp Bdcst Group...


