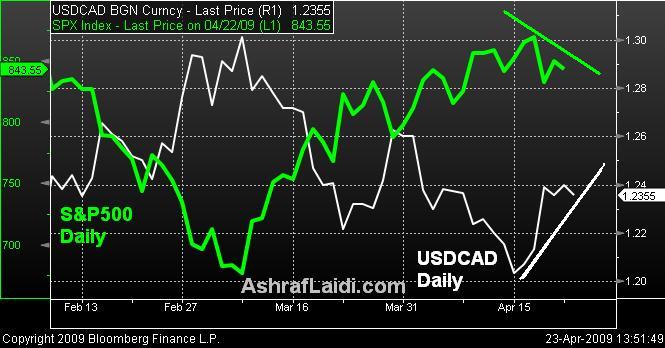
USDCAD vs S&P500

The increasingly negative correlation between USDCAD and S&P500 reflects the increasingly positive correlation between the Canadian dollar and equities, as the current represents risk appetite (widely vulnerable to declines in US weakness and oil prices and vice versa). Just we have seen S&P500 topping out at 869, USDCAD bottomed at 1.1980, while the bounce in USDCAD to 1.25 from the BoC rate cut occurred along with
the retreat in equities. Considering expectations for equity indices to consolidate into the next week before pulling back towards 800,we could see USDCAD retest 1.2440 and 1.2550. USDCAD support remains at 1.2270-80, while S&P500 resistance stands at 855 and 870.
More Hot-Charts
-

Gold Channel ABC and D
Jan 8, 2026 16:27 | by Ashraf Laidiسأرسل رسالة صوتية و كتابية توضيحية لأعضاء مجموعة الواتساب الخاصة حول هذه المخططات - Will send detailed note on latest parameters to our WhatsApp Bdcst Group - -... -

EURUSD Next
Jan 5, 2026 17:09 | by Ashraf LaidiIf EURUSD holds Monday above 1.17, it will show a hammer candle, supported above the 100-day moving average. -
Gold Next Move
Dec 26, 2025 15:32 | by Ashraf LaidiWill send detailed note on latest parameters to our WhatsApp Bdcst Group - سأرسل رسالة صوتية و كتابية توضيحية لأعضاء مجموعة الواتساب الخاصة حول هذه المخططات - ..


