EURJPY Headed Lower

by Ashraf Laidi
May 21, 2009 16:22 | 28 Comments

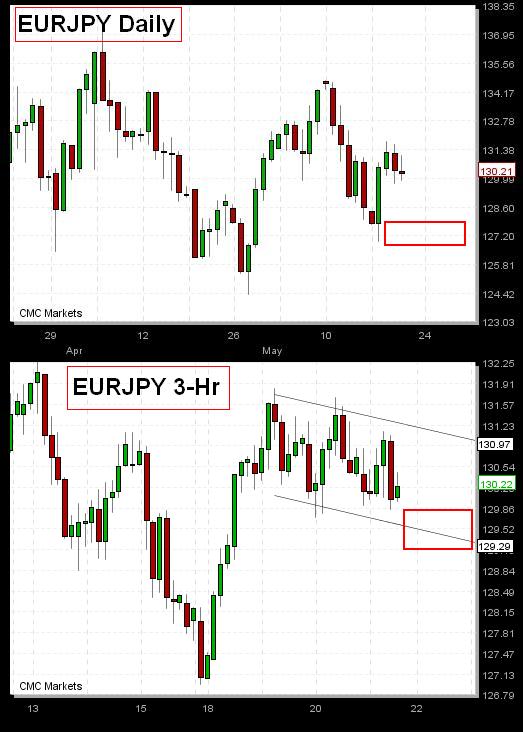
EURJPY Headed Lower - EURJPY May 21 (Chart 1)

EURJPY daily performance can be summarized as the inability to break a gradually declining trend, especially highlighted by the lower highs since April. Note that the last peak of May 10th coincided with the peak in the S&P500 and other major indices, which was followed by a 700-point slide in the ensuing 7 session. The Tuesday and Wednesday failure to regain the 131.80 resistance (61.8% retracement of 134.75-126.92) is now translating to deeper lows, which in the 3-hr chart call for 129.30-00. Subsequent target stands at 127.20, with rebounds capped at 132.00. Prolonged yen strength has more weight than euro weakness on the pair.


More Hot-Charts

  • Nasdaq100 Update

    Sep 12, 2024 18:11 | by Ashraf Laidi
    Since entering Nasdaq100 Longs on Monday at 18550, we kept accumulating and locking gains until 19230 yesterday and 19380 today.
  • Pre CPI Charts

    Sep 11, 2024 13:05 | by Ashraf Laidi
    Will Nasdaq extend gains towards 18980s this week before retracing lower on the week of the Fed.
  • Nasdaq100 Daily & Weekly

    Jul 17, 2024 17:53 | by Ashraf Laidi
    The triple top in weekly RSI suggests the following price and time implications:  . PRICE: 18700. TIME: Duration of downside may last for another 3 to 4 weeks.
Hot-Chart Archives
Comments (Showing latest 10 of 28) View All Comments
Ashraf Laidi
London, UK
Posts: 0
15 years ago
Jun 5, 2009 13:07
tarek, EURJPY could try to test 136 in case of poor US figures but as long as payrolls are better than -500K, we could see nore yen losses and a rise towards 138.

Ashraf
tarekalex
alex, Egypt
Posts: 14
15 years ago
Jun 5, 2009 12:59
mr ashraf
is the correction move in the market will over today
is eur /jpy will move in flat next week

thanks
Ashraf Laidi
London, UK
Posts: 0
15 years ago
Jun 4, 2009 9:37
J12, useful to add other indicators such as oscillators (play around w/ different stochastics parameters, RSIs and Williams % as well as MACD). fibonacci always helps and so moving averages.

Ashraf
J12etnies
United States
Posts: 3
15 years ago
Jun 4, 2009 6:29
Hi Ashraf,

Thank you for your answer...If I may do you usually just trade of support and resistance levels? meaning...do you use technical indicators....Because I tend to pretty much just look at support and resistance myself and I never have indicators on my charts.... don't know if I should at least check something else out...any advice would be great!

thanks in advance
Ashraf Laidi
London, UK
Posts: 0
15 years ago
Jun 3, 2009 23:05
J12, we could drop to as low as 0.77 and still be a in an uptrend. In fact, 0.7570 is the main support in AUDUSD. NZDUSD backed by 0.61. It all depends on how badly equities do. Must be nimble. But still OVERALL BEARISH USD.

tarek, look at today's HOTCHART of EURUSD. support at 1.3980. eurjpy 134 is possible.

Ashraf
tarekalex
Egypt
Posted Anonymously
15 years ago
Jun 3, 2009 21:40
mr ashraf
is this a signal that dollar will be stronger soon


in eur /jpy will we see 134 ,133
eur usd will correct to 1.40
thanks
J12etnies
United States
Posts: 3
15 years ago
Jun 3, 2009 20:39
*sorry dont know if this goes into this forum opic but your last comment mentioned them....

Do you expect AUD/USD and NZD/USD to shoot back up....or is this move due for a bigger correction?
Ashraf Laidi
London, UK
Posts: 0
15 years ago
Jun 3, 2009 15:47
tarek, now best to sell AUD and NZD vs JPY into end of session today and early Asian session. audusd could reach 0.8070, nzdusd at 0.6350.

Ashraf
tarekalex
alex, Egypt
Posts: 14
15 years ago
Jun 3, 2009 15:43
mr ashraf
where do you expect this aud , nzd will correct
when we know that the dollar will finis h this downtrend

thanks
Ashraf Laidi
London, UK
Posts: 0
15 years ago
Jun 1, 2009 23:28
tarek, i still think we may test 1.05 in USDCAD

Ashraf