Engulfing & Unconfirmed ابتلاع وغير مؤكد
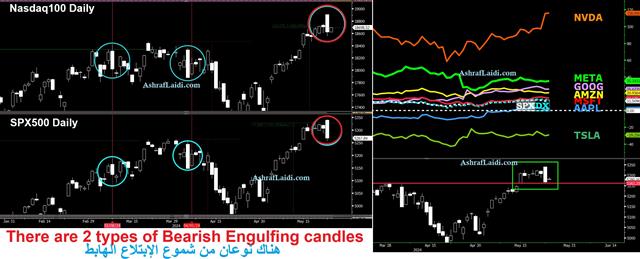
The left-hand side chart below shows bearish engulfing candles on the Daily Nasdaq100 and SPX500. Yesterday's case followed a down-candle, which usually has more bearish implications than in cases where the prior candle is an up candle, as seen in prior two cases (circled in blue). It may take as many as 2 or 3 days before the next drop emerges.
The right-hand side chart below shows how none of the Magnificent 7 stocks has managed to hit a new high despite the SPX hitting a new record 8 days ago. NVIDIA emerged as the exception, being the sole Mag7 member hitting a new high on Thursday (after Wednesday's earnings). Such lack of confirmation may raise questions, thus close monitoring about the follow-up is required next week.
All of these points will be explained in close detail to the WhatsApp Broadcast Group. Monday will be Bank Holiday in the US and UK so tune in for Tuesday's action and Friday's Core PCE.

More Hot-Charts
-

Gold Channel ABC and D
Jan 8, 2026 16:27 | by Ashraf Laidiسأرسل رسالة صوتية و كتابية توضيحية لأعضاء مجموعة الواتساب الخاصة حول هذه المخططات - Will send detailed note on latest parameters to our WhatsApp Bdcst Group - -... -

EURUSD Next
Jan 5, 2026 17:09 | by Ashraf LaidiIf EURUSD holds Monday above 1.17, it will show a hammer candle, supported above the 100-day moving average. -
Gold Next Move
Dec 26, 2025 15:32 | by Ashraf LaidiWill send detailed note on latest parameters to our WhatsApp Bdcst Group - سأرسل رسالة صوتية و كتابية توضيحية لأعضاء مجموعة الواتساب الخاصة حول هذه المخططات - ..


