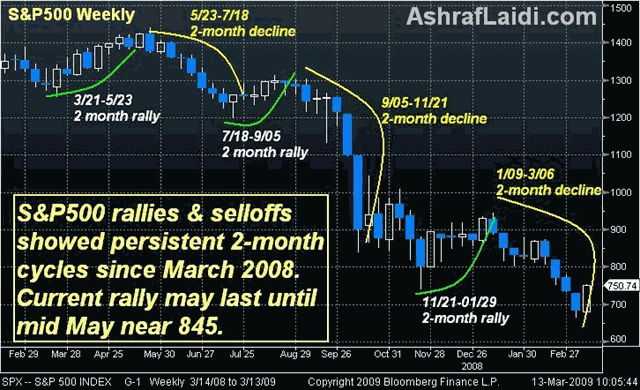
Here Comes the 2-Month Cycle
Friday 13 may imply plenty of luck for global equity markets as it could confirm the beginning of a 2-month rally in the major indices based on cyclical analysis of the past 12 months. Since mid March 2008 (1-year anniversary of the Bear Stearns bailout), the S&P500 has persistently shown rallies and declines lasting 7-8 weeks. The same rule has applied for the FTSE, DAX and the NIKKEI.

2-Month Long Bear Market Rallies
March-May 2008: S&P500 along with major global equity indices began a 2-month climb after the March 17 bailout of Bear Stearns. The bailout was accompanied by a series of liquidity-enhancing measures from the Fed and other central banks, such as extending the duration of credit lines given to banks, and broadening the types of securities purchased by these central banks. The intervention of authorities provided a temporary sense of relief that could not last beyond end of May.
July-September 2008: Global equity indices were stimulated by various factors such as the US-led consumer stimulus package, broadening central bank currency swaps and credit-expanding loans as well as a global inflation boom, which proved helpful for profit margins.
November-January 2008-09: Coordinated global interest rate cuts, concerted stimulus packages from the US, UK, Germany and China, credit-market specific announcements such as TARP and TALF, and promises of bailouts to ailing auto sectors were among the factors driving short-sellers to book profits ahead of the end-of-year closing. Seasonal analysis has also shown that the last 4-5 weeks of the calendar year usually involve a paring down of the trends prevailing in the third quarter of the year.
Where to From Here? I've shown in previous notes that since the equities peak of autumn 2007, global indices have shown rallies that were no more than 25%. (The Nov-Jan rally of 28% proved the exception as it involved three interim declines of 7%). With the likely duration of the current rally expected to last for about 8 weeks and extending for about 25%, the S&P500 may reach the 850-860 level as the next target for possible re-emergence of selling into end of June. Technically, 850 coincides with the 100-day moving average, which has not been broken since June 2008. Accordingly, major equity indices such as FTSE-100, DAX and NIKKEI-225 may also accumulate gains of similar magnitude and duration as was proven over the past 12 months.
The currency implications suggest further erosion in the US dollar against its higher yielding counterparts, specifically, EUR, AUD, NZD and NOK, while GBP and CAD are to show the most resistance in gaining vs the greenback. Yesterdays note illustrated how the dollar index (against basket of 6 currencies) failed to breach above its 7-year trend line resistance of 89.60, which also mark the 38% retracement of the decline from the 2002 high to the 2008 low. Today, the index is at 87.27, reflecting the prolonged decline in USD vs most major currencies. The $1.2930 target in EURUSD has now been breached, making way for $1.3070 and $1.3350, while GBPUSD carries momentum to test $1.4160, followed by $1.4410. USDJPY to remain capped at 100.80. Oil prices could be emboldened by a combination of additional OPEC cuts, USD losses and improved risk appetite and garner a climb a towards $50.20.


