Intraday Market Thoughts Archives
Displaying results for week of Feb 11, 2024Trouble with Concentrationمشكلة مع التركيز
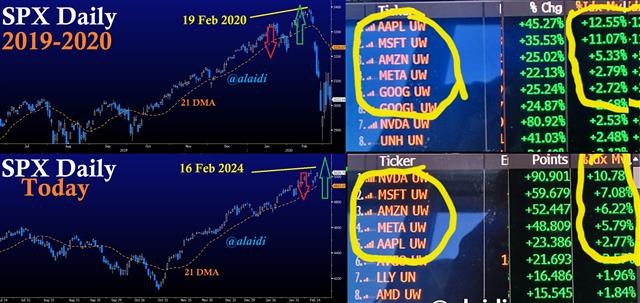
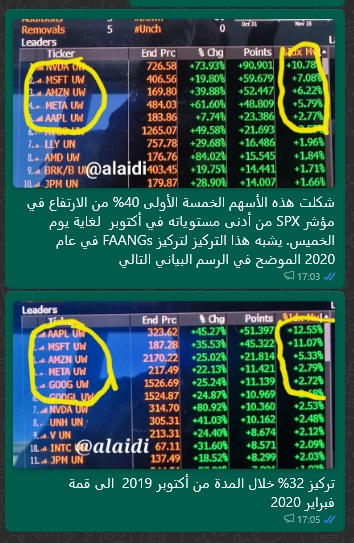
You've all read about the surging concentration of fewer stocks (Magnificent 5) controlling the latest record breaking rallies in indices. This reminds me of exactly 4 years ago today, when the FAANGs were making up over 40% of the rally, especially during that late upward thrust from October 2019 to the peak of February 2020. The current rally also reminds me when I started shorting SPX in Nov 2019 and held on thru the selloff of late Jan 2020. The profits were short-lived as the market rebounded to hit a new high into 19th of Feb 2020, forcing me out of the position before ... markets collapsed on Covid-19.
Polls, Trillion Bitcoin, SPX Gap & VIX Count
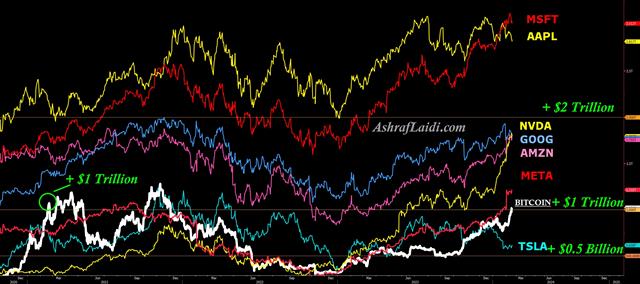
Bitcoin's market capitalisation regains $1 trillion for the 1st time since late 2021, it reminds us that it was 3 years ago minus 4 days when it first broke this landmark. As Bitcoin approaches Meta, the inevitable cross-over (BTC > META) will draw more scrutiny as Meta is the 2nd fastest gainer YTD of the Magnificent7 at 38%, versus NVDA (51%), AMZN (12%), MSFT (9%), GOOG (2%) and AAPL (-2%).
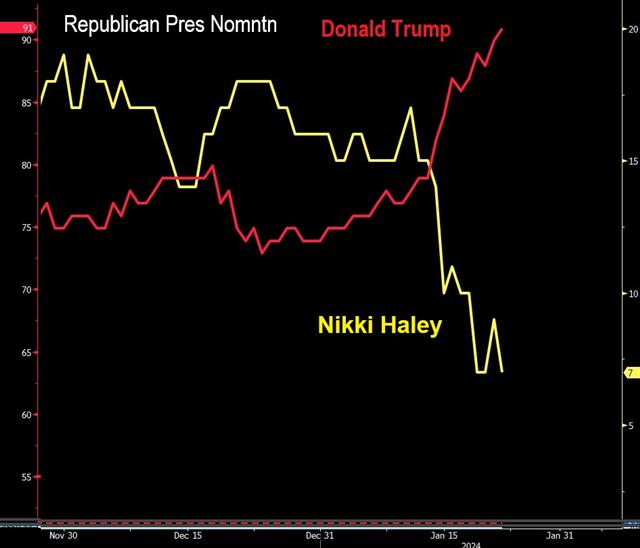
The 2nd chart shows the evolving standing of Trump's improving polling numbers in the US presidential polls as well as the candidacy for Republican leadership. As Haley's numbers tumble further, Trump's fortunes improve to the extent of helping his SPAC Digital World Acquisition Corp (DWAC). What does the polling gap in favour of Trump over Biden? Think oil and ETFS such as the XME. More on the Unfilled SPX Gap & VIX Count below
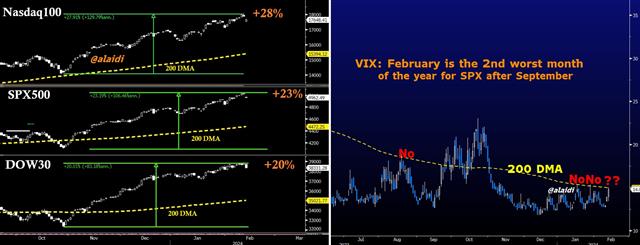
Other levels we're watching with the Whatsapp Broadcast Group is the 4.20% trendline support on the US 10yr yield and the 104 support of DXY, both of which are colluding to block XAUUSD at the 2010 level. This intermarket analysis sheds light on the potential inability of SPX to fill Tuesday's DownGap. Thus, as long as there's no close above 5015, the gap goes unfilled on a closing basis. Adding the VIX into the mix, we can observe Tuesday's successful close above the 200-DMA for the 1st time since the SVB crisis, followed two failed attempts (Jan 17 & 29) to break the 200-DMA for the VIX. Although the VIX has dropped back below the 200 DMA and 100 DMA today, it remains on an upward trend (higher lows) -- & that is the exact "failure pattern" followed on Aug 8 & 18, before soaring on Sep 26-Oct 25.
Why the Dow30 Now?
Anyone who is/was a member of the WhatsApp Bdcast Group, would know I dislike trading the DowJones Industrials Index (DOW30) due to its higher margin requirement. I usually pick the Nasdaq100 or SPX500. But over the past 3 weeks, I'd been warning the Group to prepare for shorting the DOW30. We eventually pulled the trigger last week and we're still in the trade. So why the Dow30 this time? We cited 5 reasons, some of which are listed below:
1. The Dow Theory and the lack of confirmation in the Dow Transportation to hit a new high as did the Industrials. A video was published on this here.
3. The DOW30, however, does contain Apple, which makes up about 8% of the index, and is the 2nd worst performer of the Magnificent 7. Apple and Netflix are down 0.2% and 26% year-to-date respectively.
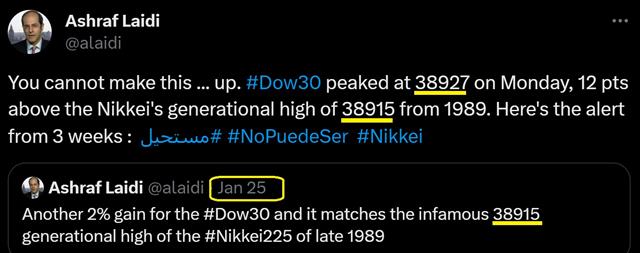
4. DOW30 likes big numbers and 38900s is equal to 20% rise from the October low. Monday's high of 38927 is nearly exactly equal to the 38915 generational top reached by the Nikkei225 in December 1989, before Japan descended into the Black Decade of the 1990s. Coincidences? The USA is far from descending into a dark decade or semi decade but the level/magnitude calls for at least a pause at the big figure.
With regards to the VIX, see the above chart how it's setting to break above the the 200-DMA for the 1st time since October after two failed attempts. A close above 15, would mean more trouble for stocks. There are other more advanced quantitative analysis requiring further scrutiny such as the VVIX and 10-yr yields.
And dont forget February is the 2nd worst month of the stock market over the last 20 years (after September).