Intraday Market Thoughts Archives
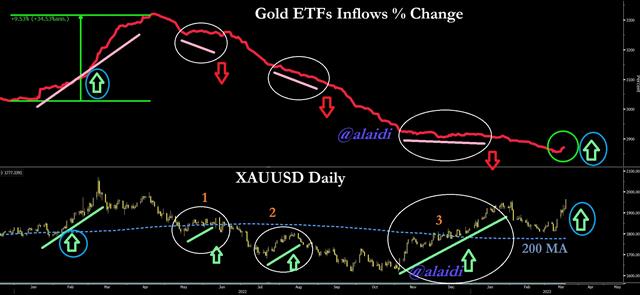
Displaying results for week of Mar 12, 2023Finally Gold ETFs Flows Do this

The top panel shows the daily percentage change of inflows in Gold ETFs, with gold in the lower panel. As you can see, inflows are finally ticking higher for the first time since May of last year. Unlike in the previous three phases of rising gold (1, 2 & 3) the latest 8 days of gold gains coincide with an increase in ETF inflows. In each of phases 1, 2 and 3 gold managed to rally despite ongoing slowdown in ETF flows, as it was aided by either USD-centric developments or dovish Fed statements. Today, the combination of the biggest 2-week decline in US-10 year yields since July 2020 + the year's 2nd largest weekly decline in DXY + (wait for it)…the steepest 2-week plunge in KBW (Banking sector index) since 2009 is generating a powerful rally in the yellow metal.
You know when you try to find out the year's best performing commodity and always find it to be some crop, or obscure scrap metal? Well, so far this year, gold is up 7.6%, only behind Iron ore (+11%) and coffee (9%). All energy commodities are in the red for the year, while copper and silver are up 2% and -7% respectively. We're only 17th of March, 5 days away from a Federal Reserve decision, that's likely to produce straightforward 25-bp rate hike and a highly confusing/messy dot-plot. Not to mention, a press conference, where Jay Powell will have to explain how the 50% reversal in quantitative tightening “is not at all QE”, as well as explain dots disparity on the terminal rate.

2 Year vs FedFunds Signal
What will happen to markets in case Feb CPI rises well over expectations? What would happen if it inflation undershot expectations of 6.0% y/y and 0.4% m/m ? The SVB implosion has eliminated odds of a 50-bp Fed hike, boosting metals and non-USD FX. Even odds of a 25-bp hike (not 50bp) are now below 60%. The chart on the left shows the straightforward relationship between odds of a 25-bp hike and gold, with the odds plotted on an inverted scale. But let's dig deep on the right-hand chart, plotting the FedFunds rate against the 2-year yield/FedFunds spread.

What's the rationale for this development? In absolute terms (not relative to other tenors), the short-end of the curve is always the last to begin pricing the end of rate hikes or rate cuts. So when 10-year yields fell below their 2-year and 3-month counterparts last autumn, the yield curve entered inversion as the longer-end began pricing slowdown/end of hikes. During that time, however, both 2-year and 3-month yields (t-bills) were on the rise. And as we know, 2-yr yields hit a 15-year high early last week. So just a reminder: Yield curve inversions usually precede rate cuts by 1-2 years, while re-steepening of the curve (when short-term yields start to fall towards longer-term yields) is usually a more accurate indicator of timing of the cuts as it is closer to it materialising.
Finally this week, both 2-year and 3-month yields registered a sharp decline, in response to deep repricing of Fed hike expectations following the collapse of SVB. The rise in US unemployment and slowdown in average hourly earnings in Friday's jobs report (full analysis here) did help to weigh on yields, USD and boost metals. When it rains, it pours -- “Risk happens fast” as the market saying goes.
If Tuesday's release of the Feb CPI comes in at or below 6.0%, then gold could easily regain $1960. This also depends on what the m/m reading does. There are various permutations from the CPI release, paving the way for a $30-40 jump in gold. What if CPI rises above 6.5% y/y? I would say stocks will generally bear the worst of such outcome, with a possible bounce in yields but eventual rally in gold following an initial selloff.
Meanwhile, our WhatsApp Broadcast Group does not waste time. 5-7 seconds after the CPI release, members will get a voice note with my immediate assessment of the whole CPI report, focusing on what it means for gold/indices/FX, later followed by text messages, trades and charts. Good luck.


