Intraday Market Thoughts Archives
Displaying results for week of Nov 13, 2016Stocks Break Relative to Yields
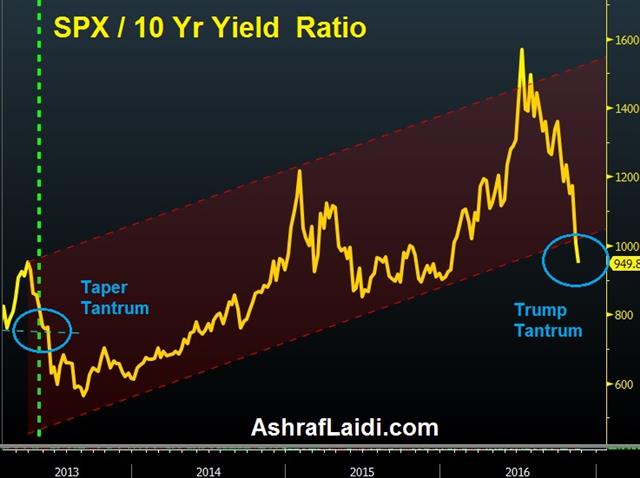
As surging yields dominate the headlines and stocks follow, questions arise as to whether the rally in yields rally would be a threat to stocks. We highlight the extent to which 10-year yields have risen relative to US stocks in the graph below via the SPX/Yields ratio, with the ratio finally breaking down below its 3-year channel support. The last time the SPX/Yields ratio broke a major support was in May 2013 --during the Taper Tantrum—a time (similar to today) when mounting Fed hike expectations sent US the 10-year yield above its 200-WMA. We must limit any comparisons to May 2013 because the Tightening Tantrum was largely a surprise due to a certain WSJ column, which is not at all the case today. Nonetheless, the technical message of the market requires a more nuanced selection of the more relevant factors as we open the first of 2 trades for our Premium subscribers.
Ashraf on BNN Earlier Today
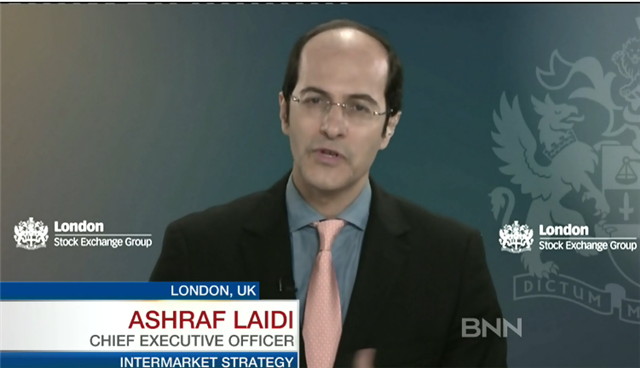
Ashraf discusses the yields rally and how it could help some central banks and hurt others. Interview.
فنيات الدولار، الذهب و النفط
Next Tuesday, picking up where we left
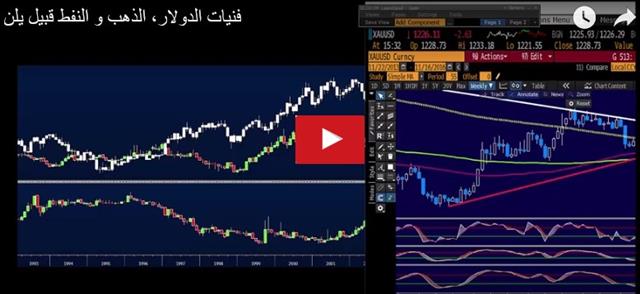
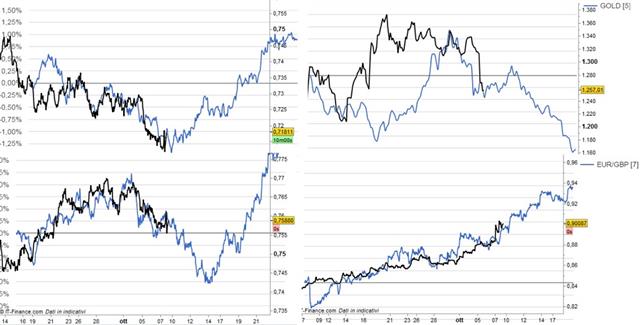
Next Tuesday, we pick things from where we left off in last month's webinar. The overarching dynamics shaping USDX, EURUSD, gold and US crude oil remain on track according to the overlay analysis we applied on FORECASTER. How will the next 5 weeks play out? How far will USDJPY rise and can the greenback drag the euro below 1.0600? This and more next Tuesday. Register here.
هل ستبقى قفزة الدولار سلبية للذهب؟
عندما كشف أسطورة صناديق التحوّط ستانلي دركينميلر الأسبوع الماضي أنه باع كل ممتلكاته في الذهب لأن كل الأسباب التي من أجلها قام بشراء الذهب في العام الماضي قد انتهت، فلم يفهم العبرة معظم الناس. بلغ مؤشر الدولار أعلى مستوى له في 13 سنة على 100.53، محققاً أرباحاً لليوم السابع على التوالي، وهي أطول سلسلة أرباح منذ مايو 2012. وخلافاً لما حدث في ربيع عام 2012 عندما استفاد الدولار الأمريكي من قوته الشرائية كملاذ آمن خلال فصل آخر في أزمة الديون في منطقة اليورو، تعتمد قوة الدولار اليوم على فكرة أن زيادة الإنفاق المالي في الولايات المتحدة في عهد ترامب ستكون إيجابية لنمو الناتج الإجمالي، التضخم والعملة الأمريكية. إذا كانت الحكومة ستمول تلك المصاريف عن طريق إصدار المزيد من الديون أو خفض الضرائب (أو مزيج من الاثنين معاً) فذلك يشكّل مصدر قلق للربع القادم. و ماذا عن السلع؟ من بين 36 سلعة قابلة للتداول، ارتفعت 3 سلع فقط خلال الشهر (النحاس، البلاديوم والقطن)، والذي يسلط الضوء على احتمالية زيادة المصاريف على البنية التحتية لسلع معينة. وهذا يثير سؤالين مزدوجين: 1) إلى أي مدى ستشد قوة الدولار الأمريكي كلاً من الذهب والفضة؛ 2) هل سيؤدي الارتفاع في احتمالية النمو والارتفاع في التضخم إلى دعم المعدنين؟ يتطلب هذين السؤالين إلى إطارات زمنية مختلفة للحصول على اجابات أكثر وضوحاً. للمتداولين، فقد نمت وجهة نظر متفرقة على نحو متزايد بالنسبة للذهب. اليوم، قمنا بنشر ملاحظات رسوم بيانية جديدة حول تداولات الفضة الموجودة لدينا بعد نشرنا لفيديو طويل ومفصّل عن المعدن الأصفر بثلاثة أيام فقط. هل هذه علامة على فرصة أو شك؟
USD's Surge & Druckenmiller Gold Dump
When hedge fund legend Stanley Druckenmiller revealed last week he sold all of his gold holdings because all the reasons for which he bought gold last year had ended, not many took notice. Today, the US dollar index hit a fresh 11-month high at 100.26, posting its 7th straight daily gain, the longest winning streak since May 2012. Unlike in spring 2012 when USD strength benefited from safe-haven buying during another chapter in the Eurozone debt crisis, the current USD strength rests on the notion that higher US fiscal spending under Trump would be positive for GDP growth, inflation and the US currency. Whether the govt will finance those spending by issuing more debt or cutting taxes (or a combination of both) is a worry for next quarter. What about commodities? Out of the 36 tradable commodities, only 3 are up on the month (copper, palladium and cotton), highlighting the prospects of increased infrastructure spending on select commodities.
This raises 2 dual questions: i) To what extent will gold and silver be dragged by USD strength; ii) Will the rise in growth prospects and uptick in inflation support the two metals? Two questions requiring different time frames for their answers to turn clearer. For traders, the gold view has grown increasingly divided. Today, we posted a new charts note on our existing silver trade, 3 days after we posted an extensive video on the yellow metal. Is this a sign of opportunity or uncertainty?
NZ Earthquake & NZ Action
Monday's NZ earthquake has proven devastating in terms of magnitude at 6.6, near the previously hit area of Christchurch. The quake was initially reported as magnitude 7.6 with aftershocks heard in the capital city of Wellington. NZD has already gapped down sharply across the board in early Monday Pacific trade with AUDNZD printing as high as 1.0760. The total cost of damage from the 2010-2011 earthquakes was estimated at NZ$15 billion – about 8% of NZ's GDP, considered twice as large in proportion in relative terms to Japan's 2011 earthquake. The bulk of damage to residential and commercial property was covered by the nation's Earthquake Commission.
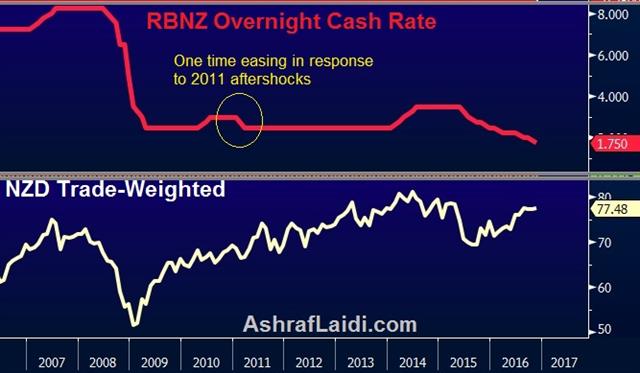
Making an assessment about the NZD remains partly dependent on the extent of any subsequent aftershocks impacting urban areas as well as the subsequent response from the RBNZ. The Sep 2010 earthquake was extreme in scale rather than in casualties, but the more devastating damage to human lives and infrastructure did not occur until Feb 2011. The RBNZ responded with a 50-bp rate cut in March 2011.
How was 2011 different from today? The March 2011 rate cut was a one-time policy easing, occurring in the midst of a policy tightening cycle, which targeted mainly damage from the quake rather than a prevailing economic slowdown. Any policy action today would coincide with rates at a record low of 1.75% but with a trade-weighted NZ rate at 16% higher than in 2011. A new NZD trade has been issued earlier this evening to Premium subscribers.
| Act | Exp | Prev | GMT |
|---|---|---|---|
| Prelim GDP (q/q) [P] | |||
| 0.2% | 0.2% | Nov 13 23:50 | |


