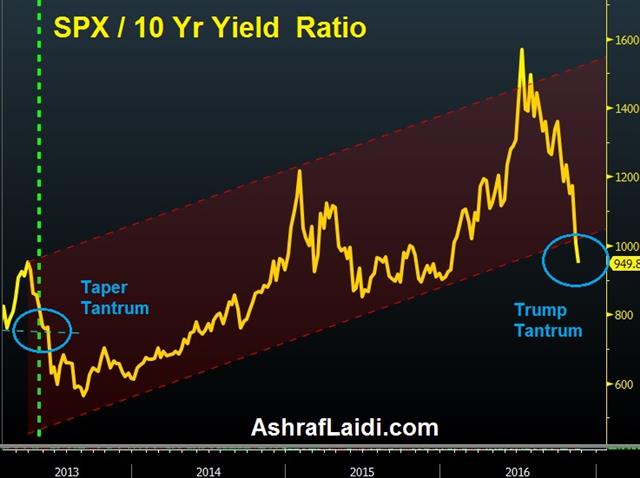
Stocks Break Relative to Yields
As surging yields dominate the headlines and stocks follow, questions arise as to whether the rally in yields rally would be a threat to stocks. We highlight the extent to which 10-year yields have risen relative to US stocks in the graph below via the SPX/Yields ratio, with the ratio finally breaking down below its 3-year channel support. The last time the SPX/Yields ratio broke a major support was in May 2013 --during the Taper Tantrum—a time (similar to today) when mounting Fed hike expectations sent US the 10-year yield above its 200-WMA. We must limit any comparisons to May 2013 because the Tightening Tantrum was largely a surprise due to a certain WSJ column, which is not at all the case today. Nonetheless, the technical message of the market requires a more nuanced selection of the more relevant factors as we open the first of 2 trades for our Premium subscribers.

Latest IMTs
-
Gold, Iran & Oil
by Ashraf Laidi | Feb 19, 2026 16:40
-
Trade Already in Profit
by Ashraf Laidi | Feb 17, 2026 18:16
-
I will go LIVE in 10 mins
by Ashraf Laidi | Feb 16, 2026 21:49
-
3 Stocks Against Nasdaq
by Ashraf Laidi | Feb 13, 2026 17:46
-
Revisiting Gold Bugs Ratio
by Ashraf Laidi | Feb 13, 2026 11:10


