Intraday Market Thoughts Archives
Displaying results for week of Feb 21, 2016Thoughts on a Rethink
The price action in markets Thursday makes an interesting case for a better turn in risk assets, we take a closer look. CAD was the top performer on the day while the yen lagged. Japanese Jan CPI was unchnaged y/y as expected. Ashraf has just added a new trade 10 mins ago from sending this post. Detailed charts and commentary will be sent out momentarily.
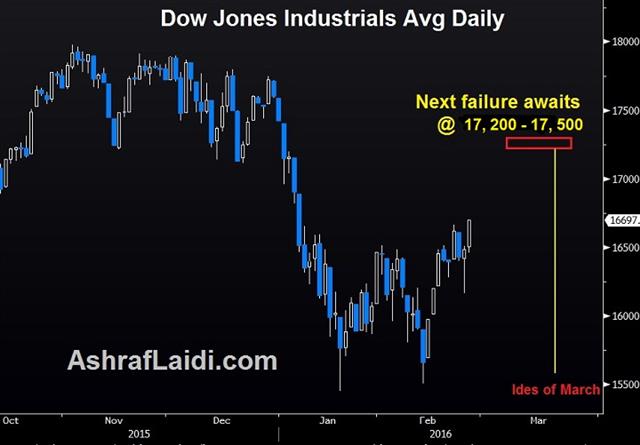
The S&P 500 broke and closed above a double-top at 1946 in the second day of gains following the turnaround yesterday. The long-suffering durable goods orders report easily beat expectations with a 4.9% rise compared to the 2.9% consensus. Details and revisions were also strong. It was on Jan 25 when Ashraf issued a detailed note/video titled "How High the Rebound", where he outlined the case for a corrective rally in US and global equity indices. It's especially impressive that the gains came on a day when the Shanghai Composite fell 6.4%. Earlier in the day oil prices were also lower.
Understanding and confidence might be the two big changes since the start of the year. In January, there was so much confusion about what was happening in commodity markets, China and the global economy. It led to some wholesale liquidation of risk assets.
In the past two weeks, the market may have discovered a better understanding of what's going on. Yes, commodity companies and resource exporting countries will struggle but that probably won't lead to major problems in the financial sector and spread to the real economy.Or will it?
There is also a growing confidence that the US economy is fine and that China isn't in the midst of a crisis. That's a low bar but exceeding it is enough for a continued gains in risk assets. The Fed's Williams underscored that outlook Thursday, saying the US economy is growing 'very well' and that he's less concerned about China than others.
Oil remains the wildcard in the equation but prices have lately proven resilient to supply builds and a retracement to $38 is certainly possible if resistance at $35 gives out. USD/CAD is certainly signaling optimism as it broke below at double bottom at 1.36. We warm, however, that oil settlement flows tend to peak around the 25th of the month so that may have exaggerated today's move.
Another theme we continue to track is the ability of developed market commodity exporters (CAD, AUD, NZD) to withstand the rout. Yesterday's Australian capex numbers were surprisingly strong and today's New Zealand trade numbers showed an $8m surplus on strong exports compared to the $271m deficit expected. Perhaps those weak currencies are doing what they're supposed to be doing – attracting investment.
Looking ahead, Japan CPI for Jan is due at 2330 GMT. The consensus is for a flat y/y reading. The Feb Tokyo numbers are forecast to show a 0.3% contraction in prices
| Act | Exp | Prev | GMT |
|---|---|---|---|
| Tokyo CPI (FEB) (y/y) | |||
| 0.1% | -0.3% | Feb 25 23:30 | |
| Tokyo CPI ex Fresh Food (FEB) (y/y) | |||
| -0.1% | -0.2% | -0.1% | Feb 25 23:30 |
| National CPI (JAN) (y/y) | |||
| 0.0% | 0.2% | Feb 25 23:30 | |
| National CPI Ex-Fresh Food (JAN) (y/y) | |||
| 0.0% | 0.0% | 0.1% | Feb 25 23:30 |
| Tokyo CPI ex Food, Energy (FEB) (y/y) | |||
| 0.5% | 0.4% | Feb 25 23:30 | |
| National CPI Ex Food, Energy (JAN) (y/y) | |||
| 0.7% | 0.8% | Feb 25 23:30 | |
| Durable Goods Orders (JAN) | |||
| 4.9% | 2.5% | -5.0% | Feb 25 13:30 |
| Durable Goods Orders ex Transportation (JAN) | |||
| 1.8% | 0.2% | -1.2% | Feb 25 13:30 |
| Exports (JAN) | |||
| $3.90B | $3.74B | $4.43B | Feb 25 21:45 |
Why the Market Turned
The intraday reversal in many markets on Wednesday highlighted two dominant undercurrents. On the day, CAD finished as the top performer while GBP lagged to another long-term low. Data on Australian capex spending is due later. In the Premium Insights, EURJPY short was closed with a 345-pip gain earlier today (opened on Feb 11) and later the GBPUSD short was closed at 1.3915 (opened on Feb 23) for a 215-pip gain.
The theme in early trading was risk aversion, that means yen strength, stocks weakness & rallying bonds. Midway through US trading, it completely reversed because of two factors: 1) The weakest Markit services PMI since Oct 2013 2) a reversal in oil.
On the surface, it's strange to credit a rally in USD/JPY to weak economic data but it highlights the market drivers at the moment. Normally, the dollar would struggle on soft data because it would mean fewer rate hikes and less yield for bond buyers. Once again, the old "bad news is good" is back.
What's changed is that bond flows are no longer dominant. The market is now so comfortable with the idea that this Fed hiking cycle will be limited to less than 75 bps of hikes and that central bank buying will permanently skew rates lower, that the usual reaction is flawed. It's assumed that 10-year rates will stay near the current range.
So what matters is Fed perception. The stock market worried about the Fed making (another?) policy mistake. If the Fed remains sidelined, even in a middling US environment, US stocks may be good alternative. However, if they hike, then there could be trouble. So soft economic data is welcomed at the moment because it makes it less likely the Fed will deliver a hawkish message in March. That was underscored by the Fed's Kaplan who characterized US growth as sluggish on Wednesday.
The second undercurrent is oil. The turnaround today was highly correlated with oil. It came after the EIA inventory data showed less supply growth than API numbers yesterday. WTI crude had fallen as low as $30.89 before rising back to $32.15. Momentum is a major factor in the oil market on the intraday swings and the correlation with risk assets is extremely high because the market is increasingly worried about the potential fallout of oil company bankruptcies and recessions in oil exporting countries. The services sector data also underscored that consumers are reluctant to spend despite cheaper gasoline prices.
Looking ahead, a separate (big) question we're trying to answer is how developed commodity exporting countries will fare in the resource bust. Australian economic data has been surprisingly robust for the past six months despite a major drop in resource capex. The sequential q/q decline in spending has been -2.6%, -5.3%, -4.4% and -9.2%. Fourth quarter data is due at 0030 GMT and expected to show another 3.0% q/q decline. These numbers have been a major driver in the past, especially planned capex for Q1.
Other events on the calendar include speeches from Bullard (0000 GMT) and Kiuchi (0130 GMT).
| Act | Exp | Prev | GMT |
|---|---|---|---|
| Markit PMI Composite (FEB) [P] | |||
| 50.1 | 53.2 | Feb 24 14:45 | |
| Markit Services PMI (FEB) [P] | |||
| 49.8 | 53.5 | 53.2 | Feb 24 14:45 |
| Fed's Lockhart speech | |||
| Feb 25 13:15 | |||
| FOMC's Williams speech | |||
| Feb 25 17:00 | |||
US Consumer Stalls, Naimi Freezes
Stocks fell alongside oil after Saudi's oil minister Al Naimi asserted that a freeze in oil production did not mean a cut and that no reduction in output would be happening any time soon. The yen and Swiss franc were the top performers while the pound lagged. Fed's Fischer. Meanwhile, If there is a big surprise in the next two months it could be the resilience of the US economy but data Tuesday dimmed hopes. 6 Premium trades are currently open, 1 of which was opened last night in GBPUSD and remains in progress.
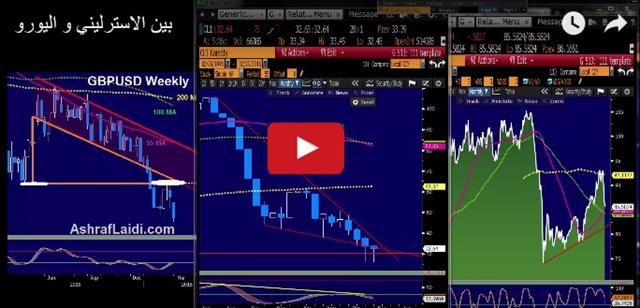
خصصنا 15 دقيقة لتحليلات صفقات الاسترليني في آخر فيديو
Low oil prices put money directly into US consumer pockets but it hasn't translated into economic growth the way the Fed and many others expected. The trend was underscored by a fall in the consumer confidence report to 92.2 compared to 97.1 expected. It was the lowest since June.
US January existing home sales report was slightly stronger than the prior month at 5.47m versus 5.45m while manufacturing continues to struggle with the Richmond Fed at -4 compared to +2 expected.
The consumer confidence report was likely dragged down by weakness in the stock market so it could recover just as quickly as it fell if sentiment turns...if it returns. Overall, it highlights the uncertainty around the US economy. The Fed sees growth around 2.5% with rising inflation. The numbers have shown no inflation and middling growth. After a mild winter, it will be difficult to find excuses if the data doesn't begin to improve.
Commodity prices remain the X-factor. Late in US trading, API reported that another 7.1 million barrels of oil went into storage last week, roughly doubling expectations. A multitude of OPEC headlines also hit throughout the day and it's abundantly clear that no one is prepared to cut production while Iran will continue to ramp up sales.
Given those dynamics, it's extremely difficult to envision that oil prices can remain at these levels. Even if the global economy expands at the high end of expectations this year it still means there is far more oil on the market than needed. Ashraf sees oil returning to $25 and below.
Trading on Tuesday underscored the oil/risk appetite dynamic. In the next phase of oil declines, look for the market to be more selective. Financials, energy-related companies and emerging market commodity exports remain the most vulnerable while consumer-related companies and import-heavy economies could hold up better.
In the middle are developed-market commodity exporters like Australia. Indications have remained solid in the past six months and any supposed trouble in China hasn't hit particularly hard. The RBA has remained constructive and so far they have been right. Skilled vacancy jobs matched the previous rise of 0.4%, while Q4 wage price index slowed to 0.5% from q/q 0.6% q/q and Q4 construction fell by 3.6%, worse than the expected decline of 2.0%.
Finally, Fed vice chair Fischer said “It is still early to judge the ramifications of the increased market volatility of the first seven weeks of 2016.” So that's more wait-&-see from the Fed's #2 ahead of the March meeting.
| Act | Exp | Prev | GMT |
|---|---|---|---|
| Existing Home Sales (JAN) | |||
| 5.47M | 5.30M | 5.45M | Feb 23 15:00 |
| New Home Sales (JAN) (m/m) | |||
| 0.520M | 0.544M | Feb 24 15:00 | |
| New Home Sales Change (JAN) (m/m) | |||
| -4.4% | 10.8% | Feb 24 15:00 | |
| Wage Price Index (Q4) (q/q) | |||
| 0.5% | 0.6% | 0.6% | Feb 24 0:30 |
| Wage Price Index (Q4) (y/y) | |||
| 2.2% | 2.3% | 2.3% | Feb 24 0:30 |
| CB Consumer Confidence (FEB) | |||
| 92.2 | 97.3 | 97.8 | Feb 23 15:00 |
| Richmond Fed Manufacturing Index (FEB) | |||
| -4 | 2 | 2 | Feb 23 15:00 |
Ashraf on BNN Earlier Today
Will Oil Shorts Think Twice?
Crude prices gained more than 6% on Monday after Russia and Saudi Arabia agreed to freeze prices at current levels. The pound finally found buyers in US trading but it was still easily the laggard on the day while the Aussie led on broad commodity strength. The Asia-Pacific calendar is light. The GBPJPY short trade of the Premium Insights was closed with a 272-pip gain, leaving five trades in progress. The Video Analysis of existing and upcoming trades has been posted and sent to Premium subscribers.
There is no easier commitment than a promise to do something that was already planned. Russia and Saudi Arabia pledged not to increase production even though neither had any designs to pump more.
Still, the announcement lit a fire under the oil market despite what was probably a more-important announcement from the IEA. They said the global surplus in production will last into 2017. Earlier forecasts had focused on mid-2016 as a time when the balance would begin to tip. Shale has proven remarkably resilient and over-supply remains the dominant theme.
S&P unleashed a fresh round of downgrades to major oil producers but there has been a remarkable lack of bankruptcies and shutdowns throughout the global energy market. So long as the market remains in surplus, sellers will limit oil bounces.
OPEC Secretary General tried some fresh jawboning, saying that if the freeze is successful, perhaps it will trigger some other action. He also said the days of OPEC cutting alone are over. With today's deal, however, OPEC now head to the sidelines and that removes a risk for oil shorts.
The main positive for oil has been increasingly positive market sentiment. Fears about the US and China are overstated and the economic data hasn't backed up the kind of rout we've had to start the year. On Monday, the Chicago Fed national activity index rose to +0.28 from -0.34.
Look for the next phase in markets to be more selective of winners and losers, rather than a wholesale de-risking. The main loser in the US economy will be manufacturing and exports due to the strong dollar. That was underscored by the Markit manufacturing PMI at 51.0 compared to 52.5 expected.
In Europe, the case for ECB action in March received a lift after Finnish hawk Liikanen said they are ready to do more next month. So far, 1.1000 has held and that's the key level in the days ahead.
Iron ore climbed 6.2% to $51.52/ton. Other industrial metals also made solid gains while gold fell 1.4% to $1208. The Australian dollar took advantage in a rally to 0.7248.
The pound remains the top story with the Brexit saga at the forefront. Sellers were finally exhausted after a fall to 1.4052 and the pair bounced 100 pips but it was still one of the worst days for GBP since the financial crisis.
At the moment, the polls and overly-dramatic UK press headlines are more important than the vote or the consequences. Expect many twists and turns over the next four months.
| Act | Exp | Prev | GMT |
|---|---|---|---|
| Markit Manufacturing PMI (FEB) [P] | |||
| 51.0 | 52.0 | 52.4 | Feb 22 14:45 |
| Chicago Fed National Activity Index (JAN) | |||
| 0.28 | -0.34 | Feb 22 13:30 | |
Missed our GBP Trades?
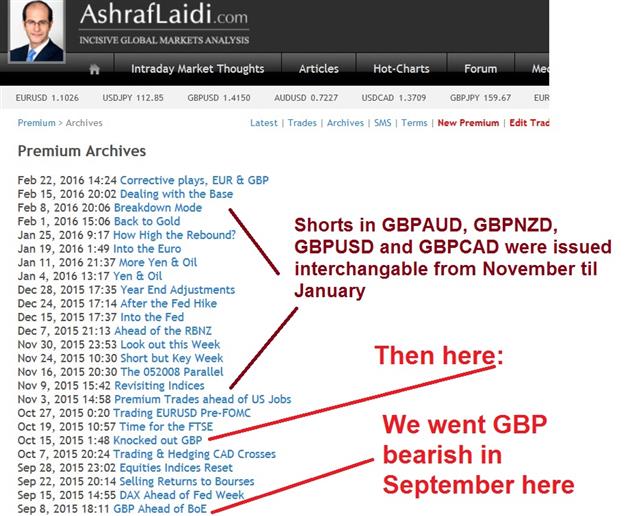
As GBP takes center stage, I am receiving several tweets and emails of charts showing the technical ugliness of the currency. So I take this chance to highlight to those (who are not subscribers) that we started issuing bearish trades in GBPUSD, GBPAUD, GBPNZD and GBPJPY since September 2015 -- a time when the market was busy with China, US stocks and oil, we sent multiple trades in GBP crosses since early Sept.
Premium subscribers will note that our "bearish GBP" momentum intensifed ahead (not after) the BoE's quarterly inflation report of early November, when GDP and CPI forecasts were dealt a major blow by the BoE's Monetary Policy Committee. Of course, this was at a time when most "big banks" were still forecasting a BoE rate hike in Q1 and Q2 2016. On December 21 webinar for FXStreet, I reiterated the 3 major reasons for my GBP shorts here.
The rest was history.
Ashraf's London Seminar this Saturday
Ashraf's London seminar at XTB's Trading Masterclass on Saturday, Feb 27. You are invited to attend Ashraf's speech at XTB's London headquarters on Feb 27th in Canada Wharf. Ashraf will join a special guest speakers to share his experience on integrating multiple time-frames into your trading strategies. An interactive Q&A session will follow.
At XTB's Trading Masterclass, you will:
● Engage in an interactive Q&A session with professional traders ● See expert investors analysing markets in real-time ● Learn how to apply multiple time-frames of analysis to your strategies
Britain’s Brexillent Adventure Begins
The pound fell sharply in early trading after London's mayor announced he's in favour of leaving the EU, following Friday's late session rally in reaction to PM Cameron's reaching a deal with the EU. Cable is down nearly 150 pips in early trading with other pairs largely unchanged. The Nikkei Japan manufacturing PMI is due later. Among the 6 existing trades in the Premium Insights, there is one GBP trade and one short in the FTSE.
Sterling surged late on Friday when Cameron and EU leaders announced a deal. Those gains evaporated and GBP fell a cent more when markets re-opened. A big reason why was that Boris Johnson, the influential London mayor and potential successor to Cameron, announced that he will campaign for a Brexit.
Another reason for pound weakness was that Cameron set a June 23 referendum date. There was always a slim chance he would back away from a promised referendum call with a deal in hand but that didn't happen. Setting a date also has a way of focusing the market on the pending uncertainty that will undoubtedly be a part of GBP trading for the next four months.
Finally, the public will now be fully engaged in the debate. The polls later this week (and subsequent weeks) will be critical for sterling and the FTSE. The tendency in such events is for Exit supporters to get early momentum as the public flirts with the idea of change. Later, as the possibility of something new and unknown nears reality, the public swings back to the safety of no change. But this will be no Scotland Referendum.
Cameron gave an early hint of how he will campaign for keeping Britain in the EU. He will stick to the tried and true tactic of warning that leaving the EU will cause uncertainty and hurt the economy. That's proven to be a formidable technique. Cameron himself used similar messages and scared the Scottish in their independence vote. Have we mentioned Scotland is highly likely to exit the UK if the latter votes to exit the EU?
In the near-term, expect a market that is hyper-sensitive to headlines. Technially, the low so far today is $1.4235, which matches last week's low. A break would open the way towards the recent cycle low of $1.4080.
Aside from the UK, Japanese stock markets opened modestly lower and there is a mild tone of risk aversion in a continuation from Friday. Yen traders will look to the Nikkei preliminary manufacturing PMI for Feb at 0200 GMT. The consensus estimate is a reading of 52.0 from 52.3 previously.
| Act | Exp | Prev | GMT |
|---|---|---|---|
| Nikkei PMI Manufacturing (FEB) [P] | |||
| 52.0 | 52.3 | Feb 22 2:00 | |
| Markit Manufacturing PMI (FEB) [P] | |||
| 52.5 | 52.4 | Feb 22 14:45 | |


