Intraday Market Thoughts Archives
Displaying results for week of Feb 26, 2023Gold's Silver Signals on Point

Can things change? Sure, next week's NFP/AHE/Unemp report will provide crucial signals on the state of labour markets and wages/earnings growth, while the April CPI (March 14) should help seal the fate of this month's Fed hike.
Fundamentals may be indicating that higher yields are not a necessary danger to metals as long as they're backed by steady inflation and soft or no-landing. So what are some technicals telling us?
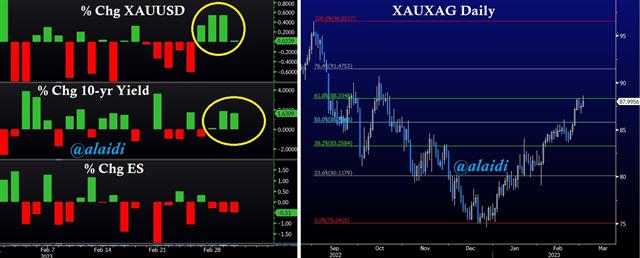
1) Gold/Silver ratio (Mint Ratio) remains capped below 90—coinciding with the 61.8% retracement of the decline from the Sep high to the Dec low. For instructions on how to glean gold signals from the Mint Ratio, take a look at this short video and my episode with Real Vision for a detailed anlaysis, or this short video.
2) Silver remains comfortably above its rising trendline support –usually an essential condition to metals' optimism –as was seen during Gold's nervous days of Oct 17-30 (see Real Vision interview again)
3) Once you have correctly concluded the positive correlation between the US dollar index and Mint Ratio, can consider the following:
- The September 1st high of 96.55 on the Mint Ratio occurred 27 days before that DXY high of 114.8.
- The 96.55 high also happened to be the 50% retracement of the greater downmove (in the Mint Ratio) from the March 2020 high to the February 2021 low.
Could the latest retracement/resistance on the Mint Ratio continue to hold? It is one thing to navigate the FOMC implications for periodic economic data. But it's also useful to heed key technical levels across the intermarket space.


