Intraday Market Thoughts Archives

Displaying results for week of Feb 27, 2022

Misleading USD Signs

Mar 3, 2022 18:23 | by Ashraf Laidi

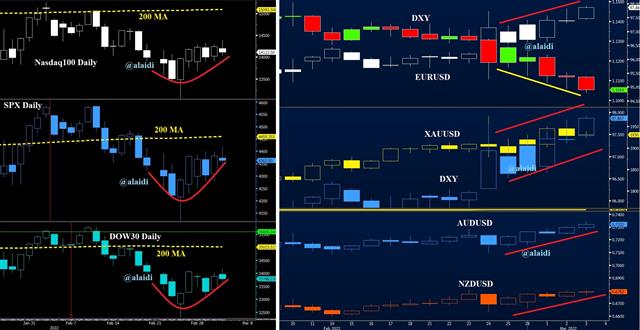
Germany's exposure to the war in the Ukraine and the resulting plunge in the euro is triggering a familiar bifurcation in the US dollar index. 58% of the DXY is held in the euro, which overlooks 3 ½ month highs in AUDUSD and NZDUSD. It is nothing new to see a breakout in dollar index (above 97.50) alongside persistent bullishness in gold and silver. The charts below highlight the latest divergence between DXY and USD's showing vs the antipodean currencies. Meanwhile, equity indices are charting a gradual bottoming, consistent with Bitcoin and Ethereum. 
Click To Enlarge
Misleading USD Signs - Dxy Vs Indices Vs Components Mar 3 2022 (Chart 1)

The case for metals and rest of commodities remains the following: Fed tightening will cap inflation at its 5-6% high, and any pullback will settle at a higher low of 3-4%. Once the Fed is forced to “fiddle” with the yield curve (prevent it from inverting), the short-end will peak out, letting 2-year-breakevens extend higher, to the benefit of metals.  The above prospect is considered as a durable positive for metals, overriding any double-blow from a nuclear deal with Iran and cease-fire in Ukraine as is shown here.

Putting strategies to work

Here is the rationale (below) behind opting for CADJPY yesterday ahead of the BoC rate decision for our WhatsApp Brodcast Group

Click To Enlarge
Misleading USD Signs - Whatsapp Cadjpy (Chart 2)

Meanwhile, equity indices are charting a gradual bottoming, consistent with Bitcoin and Ethereum. 

The case for metals and rest of commodities remains the following: Fed tightening will cap inflation at its 5-6% high, and any pullback will settle at a higher low of 3-4%. Once the Fed is forced to “fiddle” with the yield curve (prevent it from inverting), the short-end will peak out, letting 2-year-breakevens extend higher, to the benefit of metals. The above prospect is considered as a durable positive for metals, overriding any double-blow from a nuclear deal with Iran and cease-fire in Ukraine as is shown here. CLARIFICATION about our WhatsApp Broadcast Group

I need to clarify that our WBG is a Broadcast Group, which is UNLIKE regular Whatsapp Groups. This means, members of our WBG can neither see other members, nor communicate with them. All communications are between the Broadcaster (me) and members. Anonymity is intact ! Here is how to be a member.


Back to the GoldBugs Ratio

Mar 1, 2022 22:38 | by Ashraf Laidi

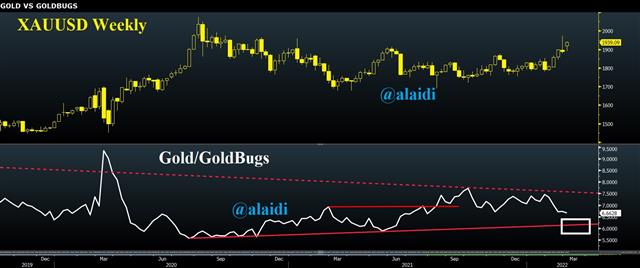
As you debate whether to take funds from your underperforming altcoins and place them in gold miners or ETFs, you take a look at the latest Bitcoin chart and decide against it. So you freeze. What to do? Do you finally realize that 60% portfolio loss in your tech stocks and re-allocate it to energy, metals or cryptos?  The chart below shows how gold is generally inversely correlated with Gold/miners, aka the GoldBugs ratio. How can it help you?

Click To Enlarge
Back to the GoldBugs Ratio - Gold Bugs Mar 1 2022 (Chart 1)

As gold rises along gold stocks (metals and miners), the latter tends to rise faster relative to bullion. I've shown in past youtube video how to use the relationship (specifically in 6:47 mins of this video)

With the goldbugs ratio in the lower panel suggesting further declines towards the 6.0 trendline support, it could argue for $2000 as early as this quarter. And it so appears that we're well on our way of getting ride of that 2013/14 fractal of horror as affirmed last week in here. Let's see what Biden/Powell have to say before buying any gold dips.