Intraday Market Thoughts Archives
Displaying results for week of Sep 06, 2015VIX: From Insurance to Assurance
Heading into next week's highly anticipated Fed decision and assessing the prospects for further market volatility, we take a look at futures' traders commitments in the Chicago Board Options Exchange Volatility Index, which have reached record high in the week ending Tuesday. How can a record surge occur when risks are nowhere near those in 2008, 2000 or 1998?
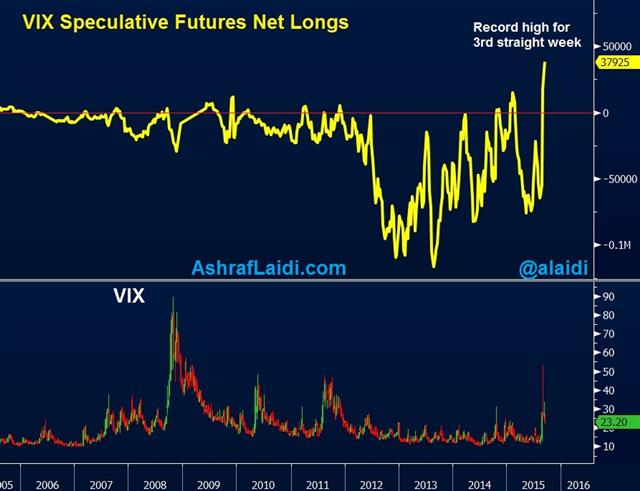
The latest data showed long contracts in the VIX exceeded shorts by a net positive 37,925 contracts, posting a record high for three consecutive weeks. Notably, positioning went from a net short of 54,894 contracts to a net long balance of 37,925 in a matter of three weeks.
Events such as the biggest daily point drop in the Dow on August 24 and the largest percentage decline in most indices since 2008, prompted by worries of a China hard landing are all directly related to the surge in the VIX.
More Record Volatility ahead
Yet, in order for the VIX and net positioning to surpass the levels of 1998, 2008 or 2011—all years highlighted by events more threatening to the financial system than today, the only reason must be innovation and technology.Volatility has evolved to becoming an asset class, exploited by quantitative trading strategies aimed at extracting profits from falling and rising volatility. A plethora of VIX derivatives (options and futures) and exchange-traded products are being used by fund managers in New York or retail investors in New Delhi.
A principal reason that August 24 saw an unprecedented 91% jump in the VIX was a scramble by volatility traders rushing to buy VIX contracts—either in the form of seeking protection against a falling market or hedging to cover short positions, initiated during “low risk” climate. Both operations amplified volatility significantly.
On the retail space, one major culprit to the VIX's violent surge has been exchange-traded notes and funds, such as the iPath S&P 500 VIX Short-Term Futures ETN, which heavily trade VIX futures in order to replicate it for hedge funds and retail investors.
As in the 1987 crash, the combination of high frequency traders and multiple derivative products aimed at betting against and on volatility -- will risk transforming volatility insurance into volatility assurance.
Next week's Fed decision will magnify volatility regardless of the outcome. A Fed hike would intensify fears of global deflationary spiral from a strong dollar and Chinese hard landing. Doing nothing will keep the threat of such a hike ongoing into each subsequent meeting. If you think the record high in VIX net longs is a contrary indicator, think again.
أشرف العايدي على قناة سي ان بي سي العربية
Why Markets aren’t Prepared For The Fed
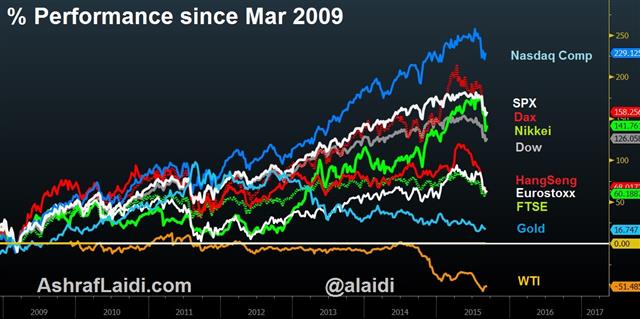
If the Fed hikes next week, we firmly believe that officials have made a huge mistake. But what's really expected of Yellen & Co remains up for debate. Markets remain choppy overall as the Australian dollar led the way in an impressive performance while the yen and dollar lagged. The Asia-Pacific schedule is mum. A new Premium trade has been added, which was last brought in early June for an eventual +500-pip gain. Five charts were added with the trade. The chart below shows the performance for the major global equity indices since the famous bottom of March 2009.
The widely-quoted statistic on what's expected from the FOMC are Fed funds probabilities. At the moment, they show a 28% probability of a hike. Economists meanwhile, have shifted their calls away from a Sept hike but more than 50% still see liftoff next week.These kinds of divergences take place periodically and almost universally, we stick with what the market is saying. But it's not quite black-and-white this time.
Fed fund measure the effective rate and the 28% chance of a hike assumes that rates will average 0.375% after the hike (that's the midpoint between 0.25% and 0.50%). But there's a reason the Fed is sticking to a range and not a target. Officials are worried they won't be able to meet a target and all indications are that it's the lower band they're worried about.
There is $2.5 trillion in cash parked at the Fed and much of it isn't eligible to earn the overnight rate (like local branches of foreign banks). That money will chase down rates and that's why the Fed has been testing term reverse repos. Once the hike is unleashed, those plans will go into action but there is no guarantee of success, especially in the early days.
So we're open to the possibility that the real implied probability of a hike is somewhere between 28% and 50% but that number isn't necessarily critical. What's more important is whether the Fed can actually hit the midpoint. If not, that might be a better reason for volatility than a hike alone.
We'll have more on this theme in the days ahead but for Thursday, the theme was US dollar weakness as soft import prices and inventories weighed. The Australian dollar was especially impressive as it rallied almost 1.5 cents from the session lows. If Chinese markets can remain stable into the weekend, there is potential for more.
| Act | Exp | Prev | GMT |
|---|---|---|---|
| Import Price Index (AUG) (m/m) | |||
| -1.8% | -1.6% | -0.9% | Sep 10 12:30 |
| Import Price Index (AUG) (y/y) | |||
| -11.4% | -11.1% | -10.5% | Sep 10 12:30 |
أشرف العايدي على قناة العربية
BOC Holds, RBNZ Cuts, Aussie Jobs Next
Central banks continue to grapple with an uncertain global economy and mixed data. The BOC and RBNZ are seeing different pictures markets are facing the same tug-of-war as emphasized by a complete intraday sentiment swing on Wednesday. Chinese CPI and Australian employment are up next. A new video of charts analysis for Premium subscribers has been issued on Ashraf's take on the major indices, including the DAX failure and the key FX pairs ahead of Thursday's BOE announcement/MPC minutes.
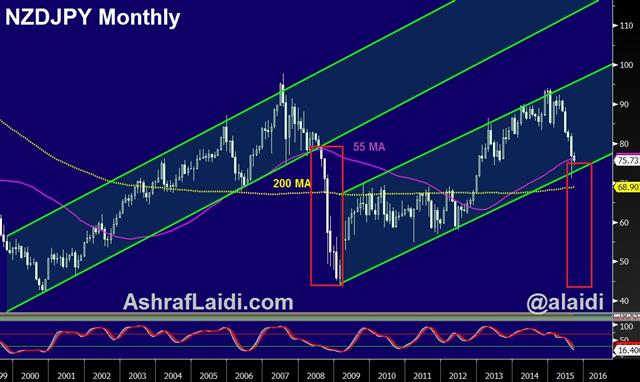
The BOC struck an optimistic tone after deciding to hold rates at 0.50%. They noted global uncertainty but were upbeat about the US economy and exports. Yet, growth in exports certainly isn't universal. Despite the massive declines in the yen, Nikkei reported the BOJ is considering lowering its outlook for exports and overseas economies at next week's meeting.
Meanwhile, the RBNZ cut rates for the third consecutive meeting and said further easing seems likely. The market had fully expected the cut but anticipated a shift toward the sidelines not more dovish rhetoric. The kiwi fell almost a cent on the announcement as Wheeler outlined a series of worries.
In markets, what had been an optimistic day -- including the eight largest Nikkei rally on record -- quickly unraveled. Sentiment was already waning when JOLTS rose to a record high at 5.75M vs 5.3M expected. That started a decline in stocks that slowly turned into a rout with the S&P 500 finishing 1.4% lower and USD/JPY off 60 pips from its highs.
More than ups and downs, the story is becoming the volatility and uncertainty in markets. This isn't an environment that's conducive for investors. The kinds of rapid gains and losses that have taken place over the past month wear down patient players and eventually sends them toward safe assets.
Looking ahead, some top tier economic data is due in the hours ahead. It begins with Chinese CPI at 0130 GMT. The consensus is for a rise to 1.8% y/y from 1.6%. A surprise further climb could curb speculation about more easing and badly undermine sentiment.
Today's RBNZ comments underscore the potential downside for Australia. The economic picture there will come into sharper focus with August jobs data, which is also at 0130 GMT. The consensus is for 5.0K new jobs in addition to the 38.5K announced for July. One bad number won't radically change the picture but it could expose the underlying market jitters.
| Act | Exp | Prev | GMT |
|---|---|---|---|
| Consumer Prce Index (AUG) (m/m) | |||
| 0.4% | 0.3% | Sep 10 1:30 | |
| Consumer Prce Index (AUG) (y/y) | |||
| 1.8% | 1.6% | Sep 10 1:30 | |
| JOLTS Job Openings (JUL) | |||
| 5.753M | 5.288M | 5.323M | Sep 09 14:00 |
| Employment Change s.a. (AUG) | |||
| 5.0K | 38.5K | Sep 10 1:30 | |
| Fulltime employment (AUG) | |||
| 12.4K | Sep 10 1:30 | ||
| Part-time employment (AUG) | |||
| 26.1K | Sep 10 1:30 | ||
| Unemployment Rate s.a. (AUG) | |||
| 6.2% | 6.3% | Sep 10 1:30 | |
تداول الارتدادات في البورصات
World Bank Joins Chorus to Dissuade Fed
The chief economist of the World Bank said a Fed hike in September would risk causing panic in emerging markets in the latest warning. That didn't stop a hefty rally in risk appetite as the S&P 500 gained 2.5% and commodity currencies surged. Japanese consumer confidence and Australian home loans are due up next. A new GBPJPY trade with 2 charts has been issued. 4 Premium trades are currently in progress.
"The world economy is looking so troubled that if the US goes in for a very quick move in the middle of this I feel it is going to affect countries quite badly," World Bank chief economist Kaushik Basu told the FT, saying it could cause some panic and turmoil.
The IMF has also repeatedly warned against rate hikes and on the weekend the G20 communique released on the weekend said central banks should work to minimize negative spillovers, mitigate uncertainty and promote transparency in a clear nod to the Fed.
What could give the Fed false confidence about hiking rates is a continuation of sanguine markets like we saw today. The return of US traders led to an aggressive round of bargain hunting and the second best day of the year for the S&P 500. But as Ashraf wrote, USD/JPY didn't post a convincing signal today. Despite the S&P 500 gain, it also failed to break its recent range.
Beaten down commodity FX could provide some value here but there is a central bank minefield in the days ahead. The Bank of Canada and RBNZ decisions are due in the next 24 hours.
Up first, at 0130 GMT, the RBA releases July home loans data. There are no cracks in the housing market yet and lending is expected up 0.8% after a 4.4% rise in June. Thirty minutes later, the RBA's Lowe delivers a speech. Japan is in focus later with August consumer confidence due at 0500 GMT and machine tool orders an hour later.
| Act | Exp | Prev | GMT |
|---|---|---|---|
| Consumer Confidence Index (AUG) | |||
| 40.3 | Sep 09 5:00 | ||
| Home Loans (JUL) | |||
| 0.8% | 4.4% | Sep 09 1:30 | |
| RBA Deputy Governor Lowe Speech | |||
| Sep 09 2:00 | |||
| RBA Assist Gov Debelle Speech | |||
| Sep 09 8:00 | |||
| Machine Tool Orders (AUG) (y/y) [P] | |||
| 1.6% | Sep 09 6:00 | ||
China Trade Data Next, SNB Eyed
GBP/USD finally ended its worst losing streak since the financial crisis as it rebounded in holiday-thinned trading. CFTC positioning data showed a fresh plunge in yen shorts. In Asia-Pacific trading, Chinese trade data will be in focus but a sprinkling of data from New Zealand and Japan will also weigh. A special VIDEO CHARTS edition is available for Premium subscribers, containing Ashraf's technical take on 4 major indices and FX pairs.
News and data from the UK was quiet to start the week but that didn't stop a +100 pip rally in cable. After falling to a four-month low on Friday in the midst of nine consecutive losses, the pound finally conjured a relief rally.
At this point, it's little more than a dead-cat bounce but the upside is intriguing. The scale of the fall over the past two weeks was more than any change in fundamentals may have suggested. The July low of 1.5330 is an early upside level to watch.
Other moves that stood out with North American traders on holiday were declines in oil and the Swiss franc.
A nearly $2 decline in oil was triggered by worries about China after a 2.5% fall in the Shanghai Composite on Monday. The Swiss franc decline was more of a mystery as it trended a half-cent higher in steady buying throughout European trading.
The easy answer would be SNB buying but there were many similar-type moves throughout August and data released Monday didn't show signs of large-scale intervention. FX reserves climbed 1.7% but that was probably entirely due to a 2% rise in EUR/CHF in the month. Since the SNB is said to be a "quasi hedge fund", then would it be aware of the unfolding damage among EM-oriented mony managers and upcoming unwind of euro shorts? Would such knowledge induce the SNB into outright EUR longs?
Looking ahead, the New Zealand Q2 manufacturing survey is due at 2245 GMT. The RBNZ is entirely expected to cut rates a quarter-point on Thursday but further cuts aren't totally priced in. A soft reading here could change that or be the final factor that sends Wheeler to the sidelines.
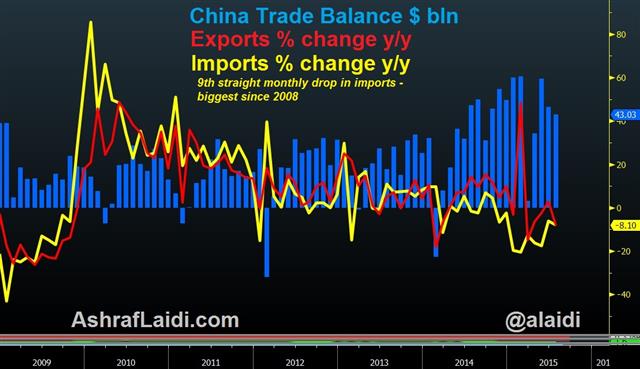
The main event to watch is the release of Chinese trade data. There is no specific time for the release but it's usually out around 2:30 GMT. The consensus is for a $48B surplus but imports and exports are the key. They're expected to contract 6.6% and 7.9% respectively. A deeper fall could trigger renewed concerns about an economic slowdown while an improvement may calm nerves.
Japan is another focus with July current account data and the final Q2 GDP report due at 2350 GMT.
| Act | Exp | Prev | GMT |
|---|---|---|---|
| Foreign Currency Reserves (AUG) | |||
| 540.0B | 531.8B | Sep 07 7:00 | |
| Imports (AUG) (y/y) | |||
| -8.2% | -8.1% | Sep 08 2:00 | |
| Exports (AUG) (y/y) | |||
| -6.0% | -8.3% | Sep 08 2:00 | |
| Current Account n.s.a. (JUL) | |||
| ¥1,715.0B | ¥558.6B | Sep 07 23:50 | |
| GDP Annualized (Q2) | |||
| -1.8% | -1.6% | Sep 07 23:50 | |
| GDP (Q2) (q/q) | |||
| -0.4% | -0.4% | Sep 07 23:50 | |
| GDP Deflator (Q2) (y/y) | |||
| 1.6% | Sep 07 23:50 | ||
| Eurozone GDP s.a. (Q2) (q/q) | |||
| 0.3% | 0.3% | Sep 08 9:00 | |
| Eurozone GDP s.a. (Q2) (y/y) | |||
| 1.2% | 1.2% | Sep 08 9:00 | |
China FX Reserves & CNY Implications
China FX reserves fell $94 bn to $3.56 tn in August, posting the biggest decline on record, tell us a little more than just China is slowing.
We already know that a key reason to the decline in reserves is China's selling of reserves, such as US treasuries, in order to support the CNY, preventing it from falling rapidly after last month's devaluation announcement.
We also know Beijing has allocated as much as $90 bn from reserves to recapitalize local banks.
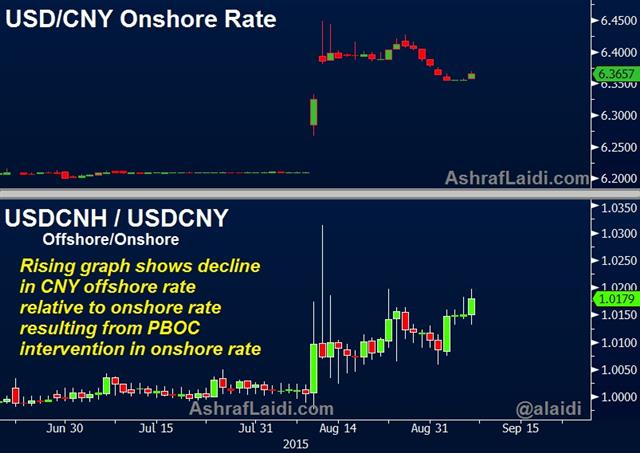
Thus, the policy of selling reserves aimed at stabilizing the CNY is unsustainable, which highlights our expectation for the currency's long term direction to be downwards. This is already shown in the chart below, illustrating that yuan's offshore rate (traded in Hong Kong) is lower than then onshore rate due to PBOC intervention in the latter and growing capital outflows impacting the former.
Back to the Fed & Yields
We mentioned last week the uncharacteristically high level of US 10-year yields relative to the recent declines in US equity indices, asking “If China were not selling treasuries to prevent CNY declines, then how low could yields be?”The declining SPX/Yields ratio, suggesting that it's a matter of time before yields catch-down with stocks, regardless of whether the Fed raises rates or not.
And so we reiterate it's a question of time before Beijing's seizes its currency manoeuvres and lets its currency depreciate. This time, instead of reversing the rise of the currency, it becomes, slowing its decline.


