Intraday Market Thoughts Archives

Displaying results for week of Jan 08, 2023

CAD on the Cusp

Jan 11, 2023 16:13 | by Ashraf Laidi

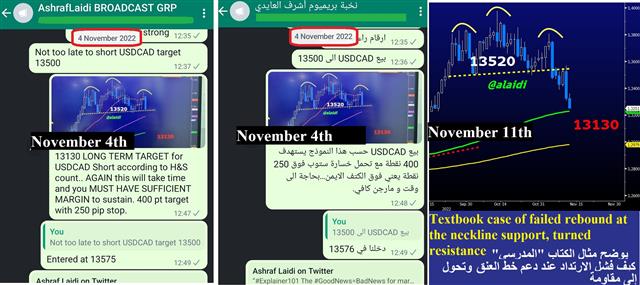
USDCAD is back down below 1.3500, not quite hitting the final Head and Shoulders target mentioned to our WhatsApp Broadcast Group members on Nov 4th [see chart below]. So what is next for the pair? Last Friday, Canada had a stellar jobs report from with employment rising (full-time and part time), unemployment falling and the participation rate gaining. See how each USDCAD rebound above the neckline failed to break the right shoulder of 1.37 during market selloffs (risk-off). Any renewed episode of market selling (possibly a strong CPI tomorrow) could lift the pair back to 1.3480/90s. Yet, my position remains unchanged (as it has since Nov 4th). Will the next phase of USD selling take us to 1.3170? What's so special about 1.3170 apart from it being a H&S targetMost pertinently, there is a unique relationship between USDCAD and its 200-DMA, which makes a retest of the average an inevitability. If you want to learn how incorporate interFX and intermarket analysis such as using the CNH H&S as a reference for your positioning alongside XAUUSD, then come to my private seminar in London this Saturday. There will be several fellow traders, a 3-course lunch from The Gherkin restaurant and a free autographed copy of my book, not to mention trading account incentives from our sponsor. 

Click To Enlarge
CAD on the Cusp - Whatsapp Usdcad Nov 11 2022 (Chart 1)

Is CNH H&S Complete?

Jan 9, 2023 20:49 | by Ashraf Laidi

On Dec 6th, I posted a chart of the USD/CNH (US dollar vs the Chinese offshore yuan), showing a striking Head & Shoulders formation. 33 days later, the H&S formation is 95-98% complete after USD fell against all major currencies. This also coincides with 10% drop in DXY from its highs. There's that "new" saw in FX about USDCNH or USDCNY becoming the new USDJPY. Regardless, 6.78 on USDCNH represents a nearly complete H&S formation. Does that mean USD has bottomed for now? Does its coincide with a USD recovery on Thursday's release of US CPI? Or, will we see a correction during the 1-2 days before CPI, followed by fresh declines. What does it portend for any coinciding technicals with gold and indices?   Here is that chart again Look where we were, and where we are now. http://ashraflaidi.com/hot-chart/dxy-cnh   Several people are flying to London this week for my Private Event on Saturday at The Gherkin. Stay tuned.