Intraday Market Thoughts Archives
Displaying results for week of Jul 19, 2015Stock Indices Going Nowhere
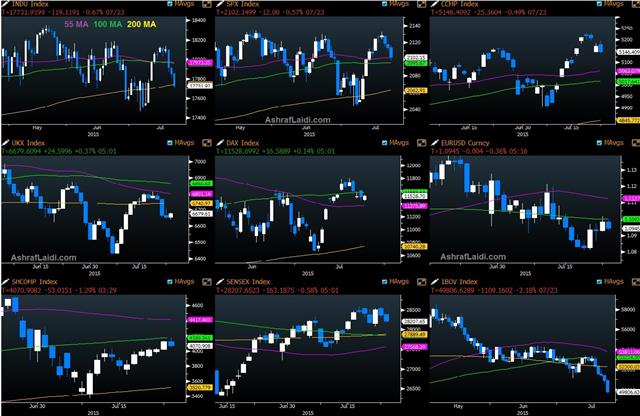
After last week's Greece-driven rally in global bourses, selling has taken over anew. You can place the blame on forward-looking concerns about Apple, Yahoo! or, resurfacing deflation fears from plunging oil and other commodities. Placing the blame on the Fed never fails—this time highlighted by worries that next week's FOMC statement could signal a September rate hike in an environment of eroding profit margins, receding earnings growth and more uncertainty from China. We still haven't changed our view about expecting the Fed to keep rates on hold this year as argued over the last 5 weeks in prior IMTs.
DJIA30
Unable to match the S&P500's retest (not close) of a new all time, the DJIA retests its 200-DMA after a series of lower highs. It's time to switch the chart to the weekly, where the 55-WMA awaits the index near 17,570s. Next week's FOMC and the subsequent week's NFP will command the balance of power, but medium-term momentum indicators continue to suggest further consolidation into end of summer, with selling the bounce near 18,200s is as certain as buying the dip at 17,170s.S&P500
Monday's failure to touch and close at a new high, followed by three consecutive daily declines towards the 55-DMA is another confirmation of lacking conviction in this bull market. Today should likely see a retest of the 100-DMA at 2095, which will require the help of a VIX bounce above 14.00. Only a break below 2080 should get the bears excited about a potential revisit to the 55-WMA. As disinflationary pressures pick up and the Fed hawks show their muscle, equities world-wide have a reason to be nervous. Durable goods orders will become important again as oil/gas explorers and miners are forced into fresh capex cuts, now that the likes of Chesapeake energy and ConocoPhillips see their rating near default territory. And let's not forget that July was the 2nd best month on average for VIX performance over the last 10 years.FTSE-100
For an index where 27% of member companies are directly or indirectly tied to energy and miners, the exposure to the latest commodities slump can't be ignored. One way to assess the FTSE100 against oil is the FTSE/Brent ratio tackled here, where the index struggles to rally relative to oil beyond a key 122 resistance level. Already trading below its key moving averages, the FTSE100 is vulnerable to extending losses towards the 6,500 level as brent is bound to break below $53.00.Tune in for further analysis on the DAX-30 and ShanghaiComposite in upcoming IMTs.
GBP: Hawkish Talk Not Enough
Bank of England MPC members continued with hawkish talk on Thursday but it wasn't enough. McCafferty was upbeat on wage gains and earnings in comments to MNI, saying they can't be ignored. Yet cable traced out a bearish engulfing candle in a sign that if the pound wants to continue keeping pace with the US dollar, it will take upbeat economic data rather than words.
The first test comes Tuesday when we get the advance look at Q2 GDP. It's expected to show a healthy 0.7% q/q gain.
The other story that continues to unfold is oil weakness. WTI crude fell as low as $48.22 Thursday before a half-dollar bounce in Asia-Pacific trading. So far the Canadian dollar has been able to hold the crisis extremes but another day or two of oil declines will break its back.
Ashraf closed out a very successful EUR/CAD earlier today.
Some risk aversion crept into markets Thursday and that weighed on yen crosses but strong corporate earnings helped turn the tide.
We continue to keep a close eye on the euro after four straight days of gains. The momentum has begun to ebb and a minor double top has traced out just above 1.1000. Economic data could determine the kext move. Up first is the French Markit manufacturing PMI, which is expected at 50.8. That's followed by the German version, which is forecast to remain unchanged at 52.5.
Signs of a pickup in manufacturing or separate services surveys from Markit could highlight the early stages of a recovery and keep the big alive or a weak reading could dash hopes again.| Act | Exp | Prev | GMT |
|---|---|---|---|
| Markit Manufacturing PMI (JUL) [P] | |||
| 53.6 | 53.6 | Jul 24 13:45 | |
| Eurozone Markit PMI Composite (JUL) [P] | |||
| 54.0 | 54.2 | Jul 24 8:00 | |
| Eurozone Markit PMI Manufacturing (JUL) [P] | |||
| 52.5 | 52.5 | Jul 24 8:00 | |
| Eurozone Markit Services PMI (JUL) [P] | |||
| 54.2 | 54.4 | Jul 24 8:00 | |
| France Markit PMI Composite (JUL) [P] | |||
| 53.3 | Jul 24 7:00 | ||
| France Markit PMI Manufacturing (JUL) [P] | |||
| 50.7 | 50.7 | Jul 24 7:00 | |
| France Markit Services PMI (JUL) [P] | |||
| 53.8 | 54.1 | Jul 24 7:00 | |
| Germany Markit PMI Composite (JUL) [P] | |||
| 53.7 | Jul 24 7:30 | ||
| Germany Markit PMI Manufacturing (JUL) [P] | |||
| 51.9 | 51.9 | Jul 24 7:30 | |
| Germany Markit Services PMI (JUL) [P] | |||
| 53.9 | 53.8 | Jul 24 7:30 | |
EURCAD Breaks to 5 mth Highs
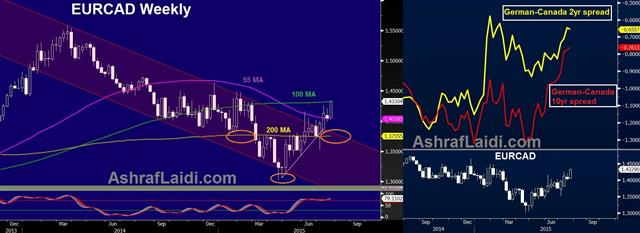
The Canadian dollar is 2nd worst performing currency year-to-date ahead of the kiwi among the top-traded 11 currencies. Selling the loonie against almost any currency over the last 2 weeks, 6 weeks or 3 months would have been a profitable trade. In early June, our Premium Insights made the case for buying EURCAD at 1.3850 on purely a technical rationale -- inverse head-&-shoulder backed by a supporting neckline-- coinciding with the 200-week MA and a trendline from the April low. Today, we exited the trade at 1.4335.
Fundamentally, the 20-bp jump in the two and ten-year spread between German and Canada bond yields has also helped propelled the pair high and was used as a foundation in our June 5th and 19th Premium notes.
Immediate resistance now stands at the 100-week MA, which coincidentally matches the 100-month MA around 1.4330. The argument for further gains rests on persistent improvement in core Eurozone nations alongside the fading of immediate Greece risks.
Renewed risks of deflation emerging from falling oil could well drag euro lower on weaker inflation, but the loonie is more likely to sustain greater losses. Does it make sense to re-embark on the trade for higher gains towards 1.4700s, or will the 1.4500 resistance becomes the ultimate barrier? Stay tuned for a new trade on this pair tomorrow.
Commodities Damage to BRICs Cushion
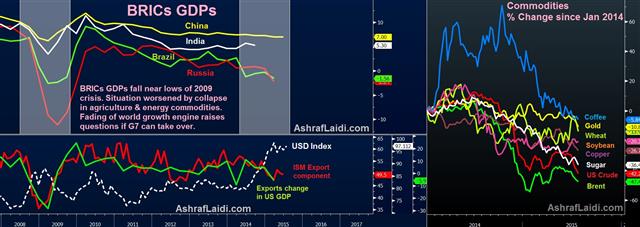
Aside from $ trillions in monetary stimulus from the world's major central banks, a major source to the recovery from the 2008-9 global financial crisis emerged from the BRICs economies. The dependence on commodities exports from Brazil, Russia and China proved instrumental in these economies' rapid comeback thanks to the cushion from rapid gains in agricultural and energy prices from 2002 to 2008. But now that agricultural commodities have crashed, metals crumbled and energy plunged, what becomes of the BRICs engine to the world economy?
BRICs Damaged by Commodities
Russia continues to depend on oil and gas with 83% of exports coming from commodities. Brazil never diversified away from its dependence on iron ore, soya, coffee and sugar and boasts a 64% commodities/exports ratio. Chinese exports of refined oil and metals have fallen substantially, driving the 3-month moving average of year-on-year exports growth to -2.0%, compared to a range of +20-30% in 2010-2013. India remains the BRICs bright spot due to broad policy reforms and a higher dependence on commodities imports (not exports).Not Like 2009
The charts of the BRICS GDPs below show that growth in Brazil and China has dropped back to the levels of the 2009 crisis lows. Russia is in recession but the main reason its contraction isn't as deep as in 2009 is that oil prices have not suffered the extent of the peak-to-trough collapse of 2008-2009. Whether we'll see a repeat remains to be seen.US Multinationals Suffer Strong USD & Lower EM Demand
In the US, the strong dollar has already dealt its punishment to US exports, as seen in the export component of the GDP and export index of the manufacturing ISM. The combined effect on US exports from the strong USD and lower EM demand doesn't appear promising. This also applies to weak Chinese demand, exacerbated by plunging stock market values. Tech blue chips such as Apple and Twitter relying on China will inevitably confront fading demand.As the Fed readies to assess the positives of falling US unemployment and new lows in jobless claims, it will be reminded by the resurfacing dangers of importing deflation. Unlike in 2008, when the US fell into crisis with a cheap US dollar and higher inflation, none of those cushions exist today, at home or at EM.
| Act | Exp | Prev | GMT |
|---|---|---|---|
| Continuing Jobless Claims (JUL 10) | |||
| 2.207M | 2.225M | 2.216M | Jul 23 12:30 |
| Initial Jobless Claims (JUL 17) | |||
| 255K | 280K | 281K | Jul 23 12:30 |
RBNZ Not Dovish Enough
The RBNZ cut rates by 25 basis points but didn't promise any further cuts and toned down its jawboning, sending the kiwi higher. On Wednesday, the pound was the top performer while the loonie lagged. Japanese trade data is next. A new Premium note and 3 charts have been added to GBPUSD. EURCAD long is currently netting 350 pips gain, while USDCAD long is +100 pips. EURAUD long is + 130 pips gain.
The market wanted ultra-dovish from the RBNZ but got only a rate cut and a hint at more in the future. There was speculation about a 50 basis point cut but Wheeler only lowered rates by a quarter-point to 3.00% and said some further easing seems likely.
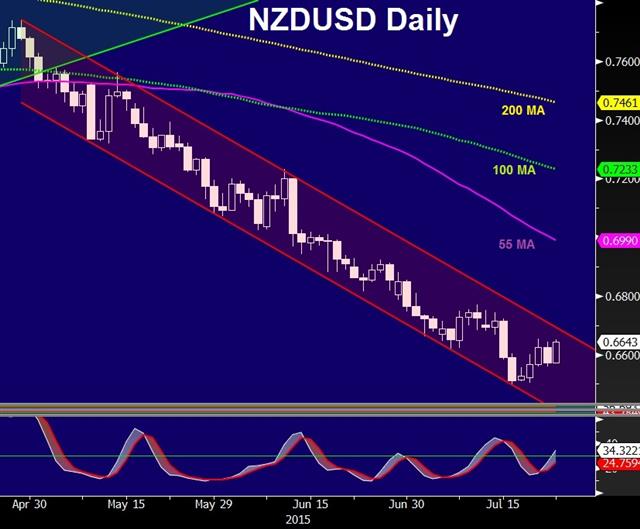
The market was looking for a harder commitment towards another cut in September. There was even talk about rates at 2.00% at year-end but it now appears the central bank will be a bit more patient. NZD/USD jumped to 0.6647 from 0.6560 on the headlines.
Anti-NZD jawboning was also toned down to reflect the +10 cent fall in the kiwi since May. In June, Wheeler said “A further significant downward adjustment is justified,” in the New Zealand dollar and this time he said “further depreciation is necessary.”
What's next? New Zealand data and dairy prices will be closely monitored but after a crash in NZD/USD to 0.6500 from 0.7700 in a straight line over the past three months, this could spell a period of consolidation, barring any extra Fed hawkishness.
It's one week until the FOMC decision and Yellen got some good economic news as existing home sales rose above the 2009 highs, up 2.49M vs 2.40M expected. That helped underpin a broad rebound in the US dollar after Tuesday's declines. The commodity currencies were under extra pressure as WTI crude fell 3.2% to below $50.
Up next, the focus shifts to how the weak yen is affecting Japanese exports. Trade balance data is due at 2350 GMT and expected to show a June surplus of 45.8B yen. The line to watch is exports, which are expected up 10.0% y/y. A strong reading could curb BOJ easing speculation and weigh on USD/JPY.
| Act | Exp | Prev | GMT |
|---|---|---|---|
| Existing Home Sales (JUN) (m/m) | |||
| 5.49M | 5.40M | 5.32M | Jul 22 14:00 |
| Existing Home Sales Change (JUN) (m/m) | |||
| 3.2% | 1.2% | 4.5% | Jul 22 14:00 |
| Exports (MAY) (y/y) | |||
| 10.0% | 2.4% | Jul 22 23:50 | |
| Adjusted Merchandise Trade Balance (MAY) | |||
| ¥-182.5B | Jul 22 23:50 | ||
| Merchandise Trade Balance Total (MAY) | |||
| ¥5.4B | ¥-216.0B | Jul 22 23:50 | |
Speculative oil & gold positioning
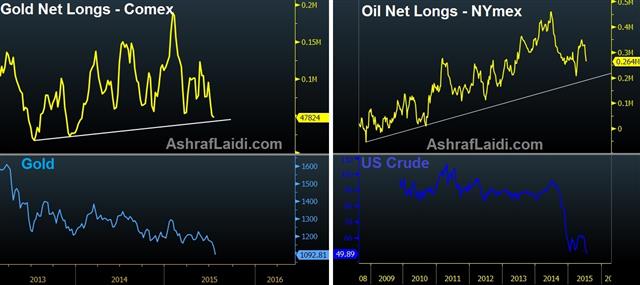
A technical look at speculative positioning among gold and US crude oil futures traders suggests more downside ahead in current longs. The reported dumping of more than 55 tonnes of gold in New York and Shanghai on Sunday night following the PBOC's revelation that it held far less gold reserved than anticipated, may have prompted Comex speculators into fresh selling.
With the trendline support standing in gold net longs standing around 42,000 contracts, a break below it this week is plausible. Next week's FOMC announcement could well be a key catalyst for swaying the balance of power further into the bearish camp, on the pretext that a September rate hike is viable.
Which brings us to oil. At time of writing, US Light Crude oil hit a fresh 3-month low at $49.07, losing 21% from its May high. Although gold has fallen 7% relative to oil from Jul 6th, the last 2 days have seen a relative recovery in the yellow metal versus oil. We have already warned against the dangers of sub- $50 oil, forcing severe cuts in capital expenditure by big oil/gas.
And considering that energy sector capex accounts for almost 40% of total capex in S&P500 companies and non-energy capex has remained below 2008 highs as companies are busy investing in their shareholders by buying back stocks and paying dividends, what would become of the corporate spending boost to the economy?
Then there is chatter that big US explorers such as Chesapeake Energy & Conoco Phillips have seen their bond ratings approach default status. Further oil decline is a question of “when” not “if”. Once oil drops below $43, prepare to see a new excuse for the bond market to further delay expectations of a Fed hike.
US Dollar Shows the Dangers of a Crowded Trade
The US dollar was dumped on Tuesday as a quiet day turned into a big drop. The euro was the top performer while the pound and dollar lagged. Asia-Pacific trading picks up with Australian CPI and Japanese machine orders are up next. A new Premium trade in EURUSD was added alongside 4 charts. There are 6 trades currently in progress.
A trickle of euro strength turned into a flood in a big retracement Tuesday. EUR/USD touched as high as 1.0970 from 1.0810 in Asian trade.
Ashraf revealed a new premium euro trade today.
US dollar weakness was widespread with the exception of sterling. The main trigger for the move was simply positioning. We scarcely read a research note or see a comment from someone who isn't a US dollar bull.
Treasury yields pushed lower on Tuesday while European sovereign yields rose and that started US dollar sales. A sour mood in US stocks added to the sentiment. Finally, the Fed released benchmark revisions for industrial production and they painted a picture of far more slack than believed.
Durable goods production was lowered by an average of 1.2 percentage points each year starting in 2012. The total production of the industrial sector is 2.6% lower than believed and that could give the Fed second thoughts about a September hike.
Another central bank that's thinking about rate moves is the RBA and it will have plenty to think about today with skilled vacancies at 0100 GMT and, more importantly, Q2 CPI at 0130 GMT. The Australian core measure is the trimmed mean and it's expected up 2.1%.
The Australian dollar shrugged off dovish RBA minutes and some mild jawboning to close a half-cent higher Tuesday. A soft CPI reading would spark renewed selling and speculation about an RBA cut before November.
Any confusion might not be long-lasting with RBA Gov Stevens slated to speak at 0305 GMT
| Act | Exp | Prev | GMT |
|---|---|---|---|
| Consumer Price Index (Q2) (q/q) | |||
| 0.8% | 0.2% | Jul 22 1:30 | |
| RBA trimmed mean CPI (Q2) (q/q) | |||
| 0.5% | 0.6% | Jul 22 1:30 | |
| Consumer Price Index (Q2) (y/y) | |||
| 1.7% | 1.3% | Jul 22 1:30 | |
| RBA trimmed mean CPI (Q2) (y/y) | |||
| 2.2% | 2.3% | Jul 22 1:30 | |
| RBA's Governor Glenn Stevens Speech | |||
| Jul 22 3:05 | |||
هل سيواصل اليورو مصرعه؟
What’s Expected From the Fed
The dollar is clearly in demand and in an effort to make it crystal clear why, we take a closer look at what's expected for the Fed. The kiwi was the top performer to start the week in a lighter day of trading while the Swiss franc lagged. The RBA minutes are due later. There are currently 5 Premium trades, including USDCAD longs. A new note will be issued on Tuesday.
US dollar trading was lumpy in New York on Monday. It rose early, was hit by quick selling and then grinded higher late. EUR/USD finished near the session low at 1.0825 to underscore the bearish bias.
The initial wave of US dollar buying came after the Fed's Bullard said there was a better than 50% chance of a Fed hike in September. The Fed has been careful to stress data dependence rather than pre-committing so comments like that have been rare. It's left market watchers with a wide spectrum of expectations.
Economists are particularly hawkish. A survey of private economists from the WSJ taken last week showed 82% forecasting a September hike. The derivatives market is far less convinced and pricing just a 40% chance.
Certainly, gold bulls appear to be frightened of a Fed hiking; something Ashraf looked at earlier today.
The bulk of US economic data is solid enough to hike but CPI, wage growth and business investment have struggled. If two of the three can pickup in the next two months of data, that would give the Fed enough confidence to hike but it's no guarantee.
Looking to Asia-Pacific trading, Japan returns from holiday and the BOJ minutes are due at 2350 GMT. Look for dovish hints but remember this isn't from the most-recent meeting so it's unlikely to make waves.
The highlight of the session will be the June RBA minutes at 0130 GMT. At the time of the RBA meeting, markets were in more turmoil due to worries about China and Greece. That was referenced in the statement and the discussion could give the minutes a more dovish feel. If so, the market won't need much of a nudge to sell AUD/USD. The market could be tepid with Stevens speaking in 24 hours.
| Act | Exp | Prev | GMT |
|---|---|---|---|
| RBA Meeting's Minutes | |||
| Jul 21 1:30 | |||
| BoJ Monetary Policy Meeting Minutes | |||
| Jul 20 23:50 | |||
Gold Erases 50% of 12-year Cycle
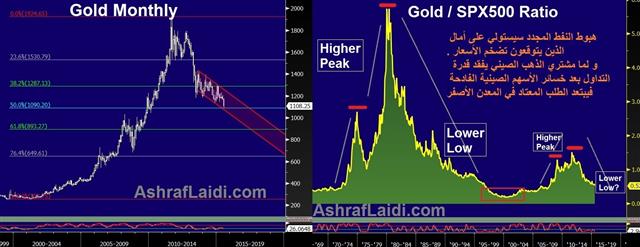
Gold's tumble to a 5-year low today is the latest manifestation of the ensuing crash in global commodities. The reasons are not new: The recent 20% decline in oil will turn an already low-inflation environment into potential disinflation. The Fed's signalling of higher interest rates as early as this year plays up yielding assets against the non-yielding metal. Chinese investors are busy dealing with massive losses in stocks, unable to mount their usual buying of gold dips.
Technically, today's gold low coincided with $1,086, which is the 50% retracement of the rise from the 1999 lows to the 2011 highs. Gold's 12-year run was based on a recovering world economy, brought about by broadening demand for agricultural, metal and energy commodities and accelerated by a falling US dollar as the US twin deficits hit record highs.
Repeating Boom-bust Gold-Stocks Cycle
Comparing gold to equities, the gold/SP500 ratio has fallen 65% from its 2011 highs to reach an 8-year low. So far the pattern appears similar to the boom-bust cycle in the Gold/Stocks ratio of 1974-1980s, when the inflation-driven supercycle in commodities propelled metals to 30-year highs relative to stocks, followed by a 2-year dip in the mid-1970s, only to rally again on soaring inflation and geopolitical shocks (Soviet-Afghan war) and Iran Revolution.Eventually, gold's damage from the late 1980s into the 1990s sent the gold/stocks ratio to new lows.
If the $1,080 gives way to technical selling, then prolonged downside calls up $1,030, followed by $920. But can the Fed still raise rates if returning disinflation becomes deflation?
| Act | Exp | Prev | GMT |
|---|---|---|---|
| Treasury Sec Lew Speech | |||
| Jul 20 18:30 | |||
CAD on a Cliff Edge, USD in Demand
The Canadian dollar hit a six-year low on Friday but that could turn to a 10-year low this week. The US dollar and pound were easily the best performers last week while the euro and kiwi lagged. CFTC positioning showed a jump in US dollar longs except in one conspicuous spot.
Bank of Canada Governor Stephen Poloz came to the bank of Canada from Export Development Canada. He's really should have valuable contacts with exporters. Yet he's consistently over-estimated how much Canada could sell abroad.
The takeaway from recent Canadian trade data and the BOC press conference was how disappointing exporters have performed despite a 22% rise in USD/CAD year-over-year. That might just be a lag but USD/CAD first struck 1.28 in January and the early returns aren't encouraging.
The level to watch in the days ahead is the crisis high of 1.3065 (spot at 1.2972). If it breaks, there is very little resistance to slow the march of the pair. It could come in tandem with a break in oil prices. On Friday, WTI crude fell below the July low and is flirting with $50/barrel.
It's beginning to look like the perfect storm.
China is the x-factor at the moment. Shanghai stocks gained 1.6% last week in a less-volatile week of trading but they could erupt or break down any moment. Otherwise, the week will begin with a quiet tone because Japan is on holiday and the calendar is light.
Commitments of Traders
Speculative net futures trader positions as of the close on Tuesday. Net short denoted by - long by +. EUR -108K vs -99K prior JPY -47K vs -64K prior GBP -24K vs -23K prior AUD -34K vs -22K prior CAD -41K vs -32K prior CHF +3K vs +6K prior
It's no surprise that USD longs are rising and we expect them to continue rising. What stands out is the failing conviction in USD/JPY longs. The market may have been wrong-footed by the recent correction and is searching for a quicker trade in euros or commodity FX. That may prove to be a mistake.


