Intraday Market Thoughts
Stock Indices Going Nowhere
by
Jul 24, 2015 12:04
After last week's Greece-driven rally in global bourses, selling has taken over anew. You can place the blame on forward-looking concerns about Apple, Yahoo! or, resurfacing deflation fears from plunging oil and other commodities. Placing the blame on the Fed never fails—this time highlighted by worries that next week's FOMC statement could signal a September rate hike in an environment of eroding profit margins, receding earnings growth and more uncertainty from China. We still haven't changed our view about expecting the Fed to keep rates on hold this year as argued over the last 5 weeks in prior IMTs.
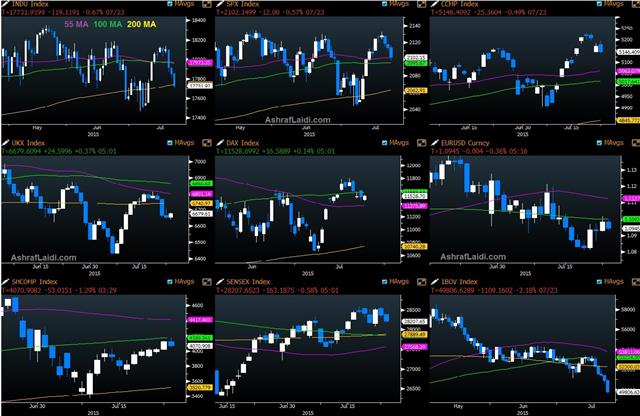
DJIA30
Unable to match the S&P500's retest (not close) of a new all time, the DJIA retests its 200-DMA after a series of lower highs. It's time to switch the chart to the weekly, where the 55-WMA awaits the index near 17,570s. Next week's FOMC and the subsequent week's NFP will command the balance of power, but medium-term momentum indicators continue to suggest further consolidation into end of summer, with selling the bounce near 18,200s is as certain as buying the dip at 17,170s.S&P500
Monday's failure to touch and close at a new high, followed by three consecutive daily declines towards the 55-DMA is another confirmation of lacking conviction in this bull market. Today should likely see a retest of the 100-DMA at 2095, which will require the help of a VIX bounce above 14.00. Only a break below 2080 should get the bears excited about a potential revisit to the 55-WMA. As disinflationary pressures pick up and the Fed hawks show their muscle, equities world-wide have a reason to be nervous. Durable goods orders will become important again as oil/gas explorers and miners are forced into fresh capex cuts, now that the likes of Chesapeake energy and ConocoPhillips see their rating near default territory. And let's not forget that July was the 2nd best month on average for VIX performance over the last 10 years.FTSE-100
For an index where 27% of member companies are directly or indirectly tied to energy and miners, the exposure to the latest commodities slump can't be ignored. One way to assess the FTSE100 against oil is the FTSE/Brent ratio tackled here, where the index struggles to rally relative to oil beyond a key 122 resistance level. Already trading below its key moving averages, the FTSE100 is vulnerable to extending losses towards the 6,500 level as brent is bound to break below $53.00.Tune in for further analysis on the DAX-30 and ShanghaiComposite in upcoming IMTs.
Click To Enlarge

Latest IMTs
-
2x our Gains in 8 Weeks
by Ashraf Laidi | Feb 3, 2026 10:28
-
4500 and 72 Hit, now what?
by Ashraf Laidi | Feb 2, 2026 2:22
-
Warsh Odds Hit Metals
by Ashraf Laidi | Jan 30, 2026 10:56
-
Time Stamp تجزيء زمني للفيديو
by Ashraf Laidi | Jan 29, 2026 9:09
-
Trump Hits Dollar but Wait Bessent & Powell...
by Ashraf Laidi | Jan 28, 2026 11:47


