Intraday Market Thoughts Archives
Displaying results for week of Mar 14, 2021SLR, Banks, Oil & USD

Earlier today, stocks were dealt a mini shock, with USD gaining across the board after the Fed's SLR decision raised fears the banks may have to sell treasuries in order to improve their capital requirements. But the announcement seems to be a work-in-progress, with the possibility of reversing it in the event that conditions worsended.
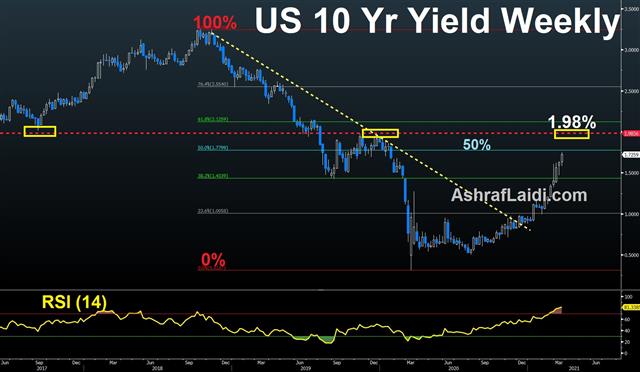
Yields are somewhat stabilizing under 1.73%, after Thursday's overshoot set off an earthquake of selling in financial assets in yet-another post-Fed slump. The BOJ deserves some of the credit as well after details of the policy review leaked and indicated a 5 bps widening of the YCC band and a halt to ETF buying except in extraordinary circumstances.The stretched trends help to explain the moves in both. WTI has rallied from the election-eve low of $33.64 to the March 8 high of $67.98 – a 102% rally.
Along the way, crude formed a tidy uptrend but it was shattered on Thursday. So how far could crude fall? The 38.2% Fibonacci retracement of the Nov-March rally is at $54.86 and 50% is at $50.81. Closer is the 55-day moving average at $57.17 with the 100-dma at $50.85.
None of those would be outside the scope of a healthy correction. If anything, they would ensure OPEC+ retains discipline even longer. Ultimately, a drop to $50 oil would be a sparkling opportunity because underinvestment and reopening demand will eventually tilt the market into a deficit but for now, discretion is the better part of valour.Fed, BoE Step Back, Yields Push up


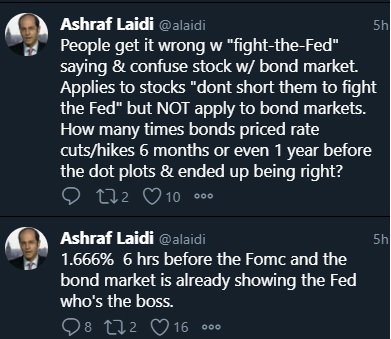
The market and the FOMC are on different pages. The market is pricing in an 80% chance of a hike before the end of 2022 and the Fed is saying there won't be a hike until 2024.
Powell tried to explain that the new reaction function for the Fed is to wait for data to show significant progress toward goals rather than relying on forecasts. He also repeatedly emphasized that they view the expected reopening rise in inflation as transitory.
The dollar sank across the board; 40 pips initially and then it continued lower. USD/CAD fell to a fresh 3-year low in the seventh day of selling.
The bond market struggled and long-dated yields initially rose on inflation fears but that later mostly reversed in an front-end led bull steepener. Naturally, stocks cheered the pledge for lower rates.
In the bigger picture, Powell and the FOMC continue to set them up for a clash with markets. He highlighted as much by saying that they won't achieve credibility on pledges to remain patient until they've proven it with actions rather than words.
So ultimately this push-and-pull between the Fed and markets will continue until sustained inflation materializes or the Fed's patience is rewarded. It's a poker game with market participants caught in between.
For now, expect the dollar to remain under pressure on the dovish Fed and for commodity currencies to remain bid.
Dots May Undermine Powell’s Message
Many in the market believe that's a cue for the Fed to signal tighter policy and that's what many are saying ahead of Wednesday's decision. However that goes against the Fed's new doctrine of running inflation hot to prove the target is two-sided.
After all, if you signal hikes as soon as 2% is on the horizon, doesn't it reinforce that 2% is a ceiling?
In all likelihood, the message Powell will send is patience. He's repeatedly highlighted high numbers of unemployed Americans and the jobs picture hasn't materially improved this year. Expect that to remain the script on Wednesday.
The problem is that the dot plot may undermine the Fed chair. Currently, 5 of 17 dots show at least one hike in 2023. It would only take 4 dots shifting in that direction to put the median at a hike. Consider that since the Dec forecasts we've had two huge stimulus package and much better Q1 GDP than anticipated and the case is compelling.
In the past the message from the dot plots has drowned out the Chairman and that threatens to happen again. Moreover, this will be the first report to include 2024 dots, which may show a path to rates at 0.75%.
Finally, the forecasts and dots will land 30 minutes before the FOMC press conference so the initial move is likely to be higher in USD and rates before Powell can even attempt to walk it back.
Overall, the Fed faces a daunting communication challenge. Only two weeks ago, the market was begging for it to talk down yields and now some are calling for a tapering signal. That pendulum can swing quickly again.ندوة أوربكس مساء اليوم مع أشرف العايدي
تابعوا الندوة الالكترونية "تحدي الفيدرالي و عوائد السندات. كيف تترجمه الأسواق؟" مع أشرف العايدي اليوم في GotoWebinarالساعة 10 مساءً بتوقيت مكة، مباشرةً من جهازك المحمول عبر تطبيق
Prices will be Paid, Ratios Remembered

The Empire Fed survey of New York-area manufacturing was slightly better than anticipated on Monday in another sign of strong demand but the real headline was in the 'prices paid' component, which continues to soar. The sequence in the past five months is: 64.4, 57.8, 45.5, 37.1, 29.1.
That's a dramatic escalation and while the Fed can promise to see through it for now, those prices are going to hit consumers who will eventually want higher wages. For now, consumers are seeing the upside of higher home prices but the costs of raw materials lag considerably. At times, companies can't pass those through the supply chain but with a tsunami of demand on the cusp of being released, there's never been a better time for companies to hike prices.
Monday's overall trade was relatively subdued. There was a brief flight into the US dollar after nearly all of Europe pulled the AstraZeneca vaccine on blot clotting worries. That's unfortunate but the market quickly rebounding, perhaps concluding that fears are overblown or that other vaccines will quickly fill the gap. EU officials will have an update on Tuesday.
That news will compete with the US February retail sales report. The consensus is for a 0.5% decline after the +5.3% surge in January. The 'control group' is forecast down 0.9%. Those expected falls are in large part due to terrible weather in much of the US in the month and will be easily dismissed if they're soft. On the other hand, if the consumer powered through the cold and snow, then it's another sign of a powerful reopening trend.
China Data Highlights Re-Opening Tailwind
The February 2020 lockdown in China has since been overshadowed by the pandemic everywhere but with a slate of data to start the week, the numbers highlighted the rebound. The Canadian dollar was the top performer last week while the yen lagged; that same pair is the best trade so far in 2021. CFTC data showed a drop in the crowded euro long position.The year-over-year increases in Chinese February data were remarkable. Industrial output was up 35.1% y/y compared to 30.0% expected. Retail sales rose 33.8% y/y versus 32.0% expected and new construction starts were up 64.3% y/y.
Of course, that all reflects the depths of the shutdown as much as the strength of the recovery.
At the same time, it underscores the pipeline of positive headlines that will reverberate throughout the world as the reopening ramps up.
CFTC Commitments of Traders
Speculative net futures trader positions as of the close on Tuesday. Net short denoted by - long by +.EUR +102K vs +126K prior
GBP +34K vs +36K prior
JPY +7K vs +19K prior
CHF +14K vs +12K prior
CAD +11K vs +15K prior
AUD +8K vs +6K prior
NZD +17K vs +16K prior
Divergent policy paths from the ECB and Fed continue to show up in the CFTC positioning data as the crowded long thins out. Rate differentials have moved sharply in the US dollar's favour and all signs point to a sharp divergence in near-term growth expectations. The latter half of the year will narrow that divergence but that's a trade for later.


