Intraday Market Thoughts Archives
Displaying results for week of Jan 01, 2023Metals vs Energy Before & After
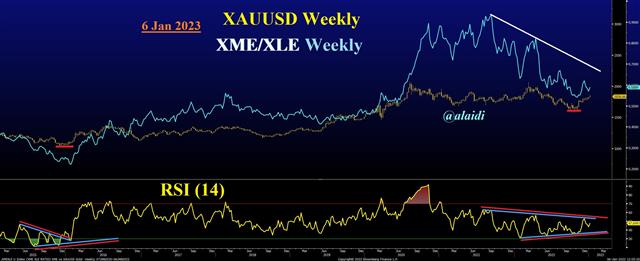
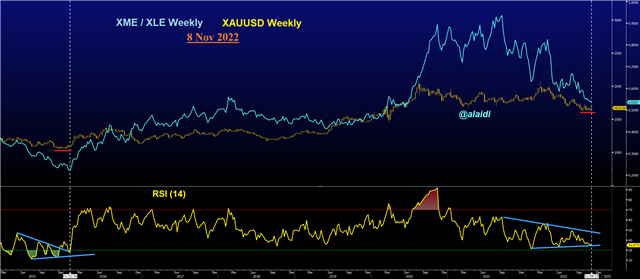
You all remember that chart of XME (Metals ETF) vs XLE (Energy ETF) I posted here on Nov 8th -- hours before Gold jumped $20 to break above $1700 and never look back. Yes, 2 hrs after the chart was posted, gold broke (and stayed) above $1700 ever since. Below is the updated chart (today) and below that is the original chart from Nov 8. What do you notice? The advancing RSI went on to test its trendline resistance and is setting to do so again. Why do I bother to chart metals vs energy? The best way to illustrate a strengthening market is to compare it to another robust/rising market...otherwise what's the point? And if inflation slows futher, what would you think happens to the battle between metals and energy?
Today's chart

Same chart 2 months ago

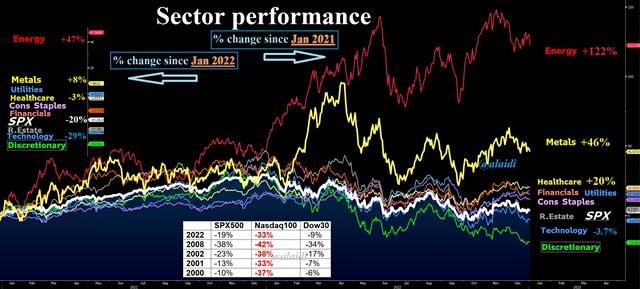
2023 Outlook Binge & Sector Dive

Members of our WhatsApp Broadcast Group (WBG) were guided through a difficult 2022 with some awful calls such as being bullish EURUSD at $1.07 in May, or long gold at 1800 in August.
But the real challenge is how to get back up when you're confidence is down?
Telling the WBG (as well as Dubai gold dealers on October 18-19th) that gold will NOT break below $1580 at a time when it had slumped to $1615 is where the value comes.
Reiterating to Group members that EURUSD will recover (and not revisit 0.99) because of unique technical developments in the EUR trade weighted index is where the originality of analysis and urgency of trading calls come through.
Using tools such as the 10-yr/3mth yield spread in this video as harbingers of USD top was also helpful -- especially amid escalating calls for 120 DXY by many and most. Selecting the right stocks in the right time will be added to our WBG offering for the year.


