Intraday Market Thoughts
Charting S&P500 Breadth & Multiples
by
Dec 2, 2013 19:57
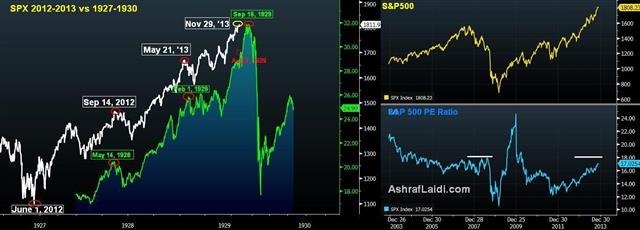
S&P500 is up 27% YTD, which if maintained, would be the strongest year since 1997. Price to earnings ratio is at 17.0, dangerously close to the 17.60 level reached in October 2007, just prior to the 2007-09 crash. But 17.0 is no comparison to the 30.0 multiples February 2000. Here is a measure of multiples, breadth and price to book with previous rallies. Click here for full charts & analysis.
Click To Enlarge

Latest IMTs
-
Gold, Iran & Oil
by Ashraf Laidi | Feb 19, 2026 16:40
-
Trade Already in Profit
by Ashraf Laidi | Feb 17, 2026 18:16
-
I will go LIVE in 10 mins
by Ashraf Laidi | Feb 16, 2026 21:49
-
3 Stocks Against Nasdaq
by Ashraf Laidi | Feb 13, 2026 17:46
-
Revisiting Gold Bugs Ratio
by Ashraf Laidi | Feb 13, 2026 11:10


