Typical Errors on Gold, Silver, USD

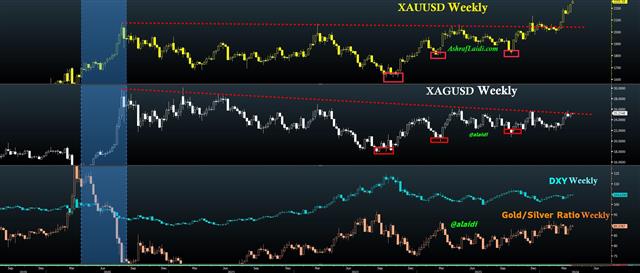
Just as we gleaned valuable information from silver and USD during the low points of gold, let's do the same during gold's latest record high. Gold has yet to make any notable pullback since breaking its 4-year trendine resistance.
Silver, however, has not yet broken its own 4-year trendline resistance.
As long as silver rally does not show the same potency and momentum shown by gold, the US dollar will continue to find support. Watch today's action for instance, how all currencies are down against the US dollar while gold is ripping at new highs.
To better understand the above thesis, take a look at Summer 2020 (blue shaded area in the chart), when gold powered to new highs alongside silver, while USD fell aggressively. In that case, the gold rally and USD plunge was a result of unprecedented quantitative easing from the Fed and other central banks. Selling USD, buying indices and buying metals was the easiest and most straightforward trade between April and early August. As long as both the Gold/Silver ratio and DXY are moving closely together (up or down), the trade becomes clear. A similar example to Spring-Summer 2020 was spring 2021.
A contrary example to the above two cases was summer 2022--when the Gold/Silver ratio powered ahead with DXY, while both XAUUSD and XAGUSD sold off furiously.
There are two clear reasons why this information is vital and useful for currency and metals traders:
1. It will help you avoid committing the amateur error of blindly shorting the US dollar just because gold is rising.
2. It will help you avoid buying silver erroneously and irresponsibly (just because gold is rising), which would be dangerous, since silver requires higher margin and involves more volatility.
Charts wise, instead of focusing on silver technicals, go straight to the technicals of Gold/Silver ratio, which reveals a neutral or range-bound formation since January, similar to that of the DXY chart, or the main individual USD pairs.
Zooming on the daily chart, you will find EURUSD, GBPUSD and AUDUSD mostly heading lower since early March. In effect, they're reverting to their medium term support.
If you have read the above 290 words of this analysis, then I shall reward you with the following 3 paragraph-summary:
1. As long as silver is not breaking key technical upside (or downside), then we it's unfeasible to see USD breaking key technical downside (or upside).
2. Said differently, the inverse correlation between silver and US dollar is more enlightening and helpful than the correlation between gold and the US dollar.
3. Identifying what is in fact the USD is also part of the equation. Using USD/CNH can help avoid the traps of DXY, which gives more weight to EUR and overlooks the ravages of JPY.
Overnight, hours after the Monday Asia open (5:16 am British Summer Time), I told our WhatsApp Broadcast Group, why I was getting out of my short-term gold Longs at 2250, allowing for a margin error of $10. Indeedm gold peaked at 2265.
This is the same WBG to which I shared why $2185 was going to be the target for our gold longs, 4 days before the March 8th release of NFP/UnempRate.
The Group was also told of the $2222 target, 10 days before it occured. The explanations, calculations and rationales are all documented on our WBG communications. Ill be happy to share all upon request.
Finally, I shared with the Group a unique quantitative rationale on why DAX40 will hit at least 18000 before mid April.
Latest IMTs
-
Gold, Iran & Oil
by Ashraf Laidi | Feb 19, 2026 16:40
-
Trade Already in Profit
by Ashraf Laidi | Feb 17, 2026 18:16
-
I will go LIVE in 10 mins
by Ashraf Laidi | Feb 16, 2026 21:49
-
3 Stocks Against Nasdaq
by Ashraf Laidi | Feb 13, 2026 17:46
-
Revisiting Gold Bugs Ratio
by Ashraf Laidi | Feb 13, 2026 11:10


