



Bullish US Long Yields
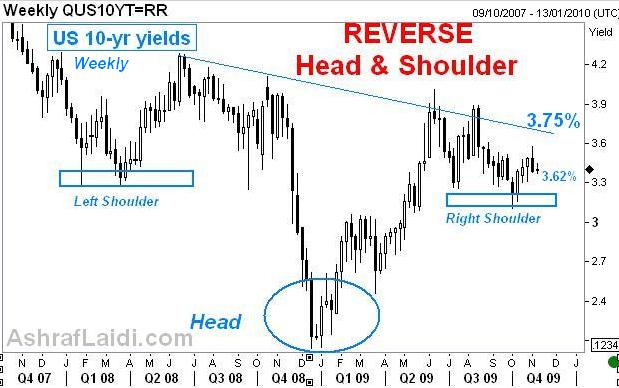
Yields on the US Treasury note show a major bullish formation, based on technicals and fundamental drivers, suggesting 4.0% could emerge before year-end. The 10-year treasury contract is the world's most liquid financial instrument; reflecting traders pricing of future inflation as well as the US govt's borrowing ability. In our July 6th piece, we predicted a bottom in 10 year yields to occur at 3.15-20% in Q4 from they stood at 3.50% at the time http://bit.ly/1msKVv . Yields eventually bottomed at 3.10% in early October before rebounding towards 3.60%. Rather than basing our fundamental argument for further yield rise solely on inflation fears, the deterioration of US govt borrowing should continue to boost long yields. The eventual signalling of an exit strategy by the Fed should further drive the reverse Head-&-Shoulder formation back into interim resistance of 3.75% (neckline), followed by 4.20%.
More Hot-Charts
-
Gold & Nasdaq100
Sep 28, 2026 10:32 | by Ashraf Laidiسأرسل رسالة صوتية و كتابية توضيحية لأعضاء مجموعة الواتساب الخاصة حول هذه المخططات - Will send detailed note on latest parameters to our WhatsApp Bdcst Group... -

Gold & GoldBugs
Sep 24, 2026 11:51 | by Ashraf LaidiIf the inverse relation between gold and goldbugs index explained repeatedly in previous videos such as here and here continues to work, then watching the 4230 level is as important as... -
Nasdaq Part 2
Sep 24, 2026 9:44 | by Ashraf LaidiNow that Nasdaq has fallen following yesterday's post, will it extend declines to 30000. What do you think of this fractal.