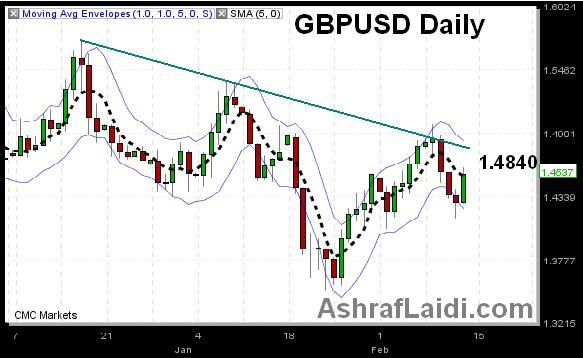
Cable's Moving Averages

GBPUSD up 3.5 cents after 3-daily declines but fades at $1.46 which is below the 50-day MA of $1.4630. Perhaps a possible sign of gradual GBP stability is the that the only four times in which GBPUSD has closed above its 50-day MA since August of 2008 were this month and in January. Nonetheless, the chart shows cable remains well within + (-) 1% envelopes of the 5-day MA. This trend along with Dec TL resistance establishes pressure at $1.4840. Subseq resist stands at $1.4980. Downside trend remains intact, targetting $1.4140.
More Hot-Charts
-

Mystery Charts
Feb 5, 2026 20:48 | by Ashraf Laidiسأرسل رسالة صوتية و كتابية توضيحية لأعضاء مجموعة الواتساب الخاصة حول هذه المخططات Will send detailed note on latest parameters to our WhatsApp Bdcst Group... -

2hr Gold Chart
Feb 3, 2026 13:09 | by Ashraf Laidiسأرسل رسالة صوتية و كتابية توضيحية لأعضاء مجموعة الواتساب الخاصة حول هذه المخططات Will send detailed note on latest parameters to our WhatsApp Bdcst Group... -

Gold Net Longs
Feb 2, 2026 17:16 | by Ashraf LaidiI really dislike after-the-fact analysis, but looking at this chart of Gold speculative net longs at the Comex, it shows speculators began lightening their longs on Jan 23.


