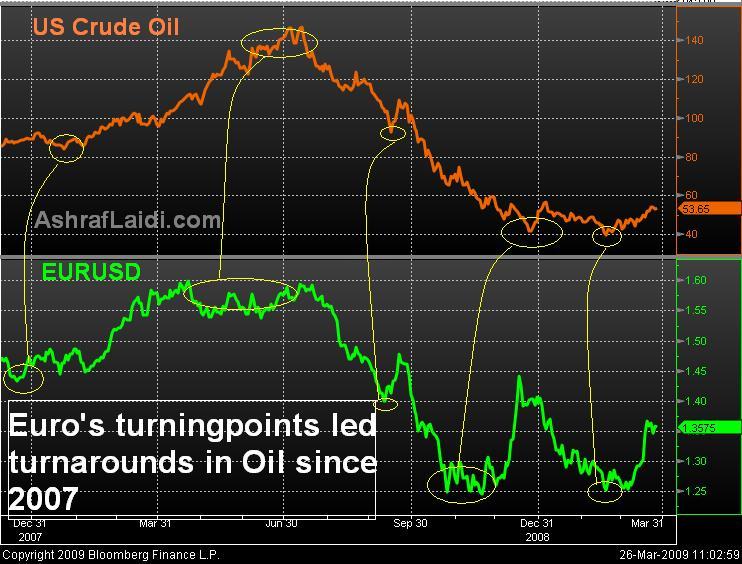
EURUSD and Oil

While the positive correlation between EURUSD and oil is well documented the time lag between the two merits scrutiny as it has turned consistent in favour of the euro over the past 16 months. The chart shows that bottoms in EURUSD have led bottoms in oil prices and so have peaks in the exchange rate and oil. Considering $1.33 to likely hold into mid April, this will likely boost oil into $55. The major downside for the euro is for the repetitive failure to breach above $1.3740 to transition into a new wave of selling into $1.3245 and $1.31 inn which case may trigger $47 per barrel.
More Hot-Charts
-

Mystery Charts
Feb 5, 2026 20:48 | by Ashraf Laidiسأرسل رسالة صوتية و كتابية توضيحية لأعضاء مجموعة الواتساب الخاصة حول هذه المخططات Will send detailed note on latest parameters to our WhatsApp Bdcst Group... -

2hr Gold Chart
Feb 3, 2026 13:09 | by Ashraf Laidiسأرسل رسالة صوتية و كتابية توضيحية لأعضاء مجموعة الواتساب الخاصة حول هذه المخططات Will send detailed note on latest parameters to our WhatsApp Bdcst Group... -

Gold Net Longs
Feb 2, 2026 17:16 | by Ashraf LaidiI really dislike after-the-fact analysis, but looking at this chart of Gold speculative net longs at the Comex, it shows speculators began lightening their longs on Jan 23.


